Indicator 25: Size and average age of the vehicle
fleet
|
Since 1970, the EU car fleet has grown by a factor
2.5, which has resulted in a significant increase in passenger car transport.
The average age of the passenger car fleet is increasing (from 6.1 years
in 1980 to 7.0 years in 1997) indicating a slow penetration of more modern
technologies.
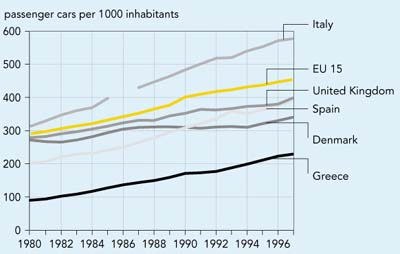
Figure 6.13: Development of car ownership (EU)
Source:
Eurostat, DG Transport
Objective
- Reduce growth in fleet size.
- Improve fleet composition (e.g. age).
Definition
- Vehicle fleet size and average age (road, rail, air vehicles)
|
Policy and targets
Size of vehicle fleet is an important determinant
of transport demand and thus has major implications for the environmental impacts
of transport. Car ownership is closely correlated with GDP and has grown dramatically
over recent decades. However, there are no EU or Member State targets relating
to vehicle fleet size.
Increasingly tight regulations have resulted
in the gradual introduction of more fuel-efficient, less polluting, less noisy
and generally safer road vehicles. The average age of the vehicle fleet is therefore
an indirect indication of the environmental performance of road transport.
An older fleet generates more atmospheric
emissions than a younger one, but more rapid vehicle replacement has a downside:
it increases the amounts of energy and materials used for vehicle construction,
dismantling and recycling. Because the differences between older vehicles and
most new ones are substantial, a young vehicle fleet is likely to have better
overall environmental performance than an older one. No EU or Member State targets
appear to exist for the average age of the vehicle fleet.
In the 1990s, several Member States introduced
scrappage schemes to improve the environmental performance of their car fleet:
Greece (1991-1993), Denmark (1994-1995), Spain (1994 till now), France (1994-1996),
Ireland (1995-1997), and Italy (1997-1998) (ECMT, 1999). Such programmes only
result in environmental improvements if the new vehicles have emission rates
substantially better than older models and if the environmental impact of vehicle
construction and dismantling processes is reduced. The proposed Directive on
end-of-life-vehicles provides that vehicles on the market after 1 January 2005
should be re-usable and/or recyclable to a minimum of 85 % in terms of
weight per vehicle and are reusable and/or recoverable to a minimum of 95 %
in terms of weight per vehicle (CEC, 1997, amended by COM (99) 176).
Other options for reducing the average
age of the vehicle fleet include:
- having higher annual taxes on older vehicles;
- enhancing inspection and maintenance requirements,
which will make the operation of older cars more costly and encourage their
replacement.
Findings
Since 1970, the number of passenger cars in the EU
has increased by a factor of 2.5, an average of 3.4 % per year. Several
factors have contributed to this growth, the most important probably being
increasing incomes, the relative prices of transport, and socio-economic developments
that encourage the use of private cars.
Between 1970 and 1997, the growth in the number of
passenger cars was highest in Greece (8.4 % per year), Portugal (6.9 %
per year) and Spain (6.6 % per year). These countries had by far the
lowest numbers in 1970. The Member States with the lowest growth were Sweden
(1.5 % per year), Denmark (1.7 % per year) and the United Kingdom
(2.3 % per year).
With few exceptions (e.g. Denmark and Italy), the
stock of passenger cars correlates well with GDP per capita. In 1997, the
number of vehicles per inhabitant ranged from more than 1 per 2 inhabitants
in Italy, Luxembourg and Germany, to fewer than 1 per 3 inhabitants in Greece
and Portugal.
About 200 million bicycles contribute to mobility
in an environment-friendly manner (Source: DG Transport).
Figure 6.14: Estimated average age of the
EU15 passenger car fleet (including former East Germany) and of some national
car fleets
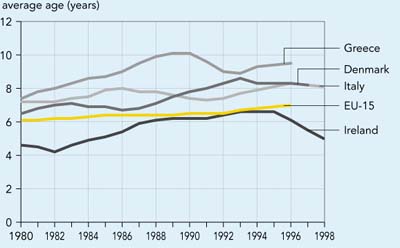
Source: Eurostat
The average age of the European passenger car fleet
increased from 6.1 years in 1980 to 7.0 years in 1997 (Figure 6.14). The effect
of scrapping schemes that have been used in Greece, Denmark, Ireland and Italy
can be seen in Figure 6.14 schemes were operational in1994-1995 in Denmark,
1991-1993 in Greece, 1995-1997 in Ireland and 1997-1998 in Italy.
There are significant variations in the average age
of car fleets across Europe, with the lowest in Luxembourg (4 years) and the
highest in Portugal (11 years). Ireland and Belgium also have low average
ages and Greece, Finland and Sweden have high average ages. The high average
age in Portugal and Greece relates to general economic conditions, while the
high ages in Sweden and Finland are probably a consequence of periods of economic
recession in these countries in the early 1990s. New registrations are however
growing again and vehicle fleets are getting younger.
Future work
- A joint Eurostat-UNECE-ECMT survey is collecting
data on the average ages of different types of road vehicles. The newness
of the questionnaire precludes an early assessment of trends at the EU level.
- The feasibility of providing data on average age
for freight transport (for example, light and heavy-duty vehicles) and
other transport modes (aeroplanes, trains and ships) needs to be investigated.
|
Data
Average age of the passenger car fleet in EU (estimates)
Unit: years
|
| |
1980
|
1985
|
1990
|
1991
|
1992
|
1993
|
1994
|
1995
|
1996
|
1997
|
|
Austria
|
5.7
|
6.2
|
6.5
|
6.4
|
6.4
|
6.5
|
6.6
|
6.8
|
6.8
|
7.0
|
|
Belgium
|
4.4
|
5.1
|
5.1
|
5.0
|
4.9
|
5.1
|
5.2
|
5.4
|
5.6
|
5.7
|
|
Denmark
|
6.5
|
6.9
|
7.8
|
8.0
|
8.3
|
8.6
|
8.3
|
8.3
|
8.3
|
8.2
|
|
Finland
|
6.7
|
7.2
|
6.9
|
7.4
|
8.1
|
8.3
|
8.7
|
9.1
|
9.5
|
9.6
|
|
France
|
5.6
|
6.1
|
6.2
|
6.2
|
6.3
|
6.5
|
6.6
|
6.7
|
6.7
|
7.0
|
|
Germany
|
5.3
|
5.9
|
6.1
|
8.0
|
7.4
|
6.9
|
6.9
|
6.8
|
6.7
|
6.7
|
|
Greece
|
7.4
|
8.7
|
10.1
|
9.6
|
9.0
|
8.9
|
9.3
|
9.4
|
9.5
|
n.a
|
|
Ireland
|
4.6
|
5.1
|
6.2
|
6.2
|
6.4
|
6.6
|
6.6
|
6.6
|
6.1
|
5.5
|
|
Italy
|
7.2
|
7.9
|
7.4
|
7.3
|
7.4
|
7.7
|
7.9
|
8.1
|
8.3
|
8.2
|
|
Luxembourg
|
3.6
|
3.4
|
3.2
|
3.1
|
3.2
|
3.5
|
3.7
|
3.9
|
4.1
|
4.3
|
|
Netherlands
|
4.7
|
5.5
|
5.9
|
6.0
|
6.1
|
6.4
|
6.6
|
6.8
|
6.9
|
7.0
|
|
Portugal
|
7.7
|
8.3
|
9.0
|
9.2
|
9.3
|
9.5
|
9.8
|
10.1
|
10.4
|
10.6
|
|
Spain
|
6.7
|
8.4
|
8.0
|
8.1
|
8.0
|
8.2
|
8.3
|
8.5
|
8.6
|
8.5
|
|
Sweden
|
6.4
|
7.1
|
7.4
|
8.2
|
8.2
|
8.9
|
9.0
|
9.6
|
9.5
|
9.8
|
|
United Kingdom
|
5.5
|
5.3
|
5.3
|
5.3
|
5.6
|
5.7
|
5.8
|
5.9
|
6.1
|
6.1
|
|
EU15
|
6.1
|
6.4
|
6.5
|
6.5
|
6.5
|
6.7
|
6.8
|
6.9
|
7.0
|
n.a
|
|
Source: Eurostat
|

Document Actions
Share with others