Indicator 20: Energy and CO2 intensity
Energy intensity (and therefore CO2 intensity) of
passenger and freight transport has not improved during the past three
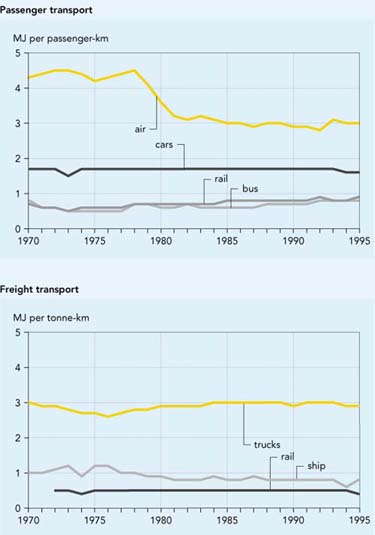
decades. Rail is the most energy-efficient mode of passenger transport.
Despite improvements during the 1970s, aviation continues to be the
least efficient mode. For freight transport, trucks consume
significantly more energy per tonne-km than rail or ship transport.
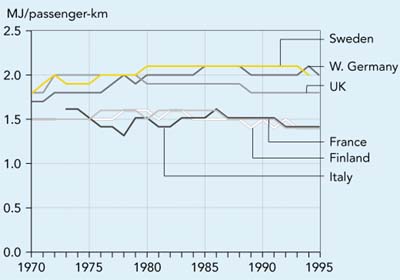
Figure 6.2: Energy intensity of passenger and freight
transport (8 EU countries)
Source: International Energy Studies, Lawrence
Berkeley Laboratory, as compiled from recognised national sources
Objective
Reduce energy use per transport unit (passenger-km or
tonne-km)
Definitions
- Energy intensity of passenger and freight transport, i.e. energy
consumption per unit of transport activity (MJ/passenger-km and
MJ/tonne-km), and by mode.
- Fuel efficiency of new cars and of total car fleet, i.e. fuel use
per km (litre/100 km)
Note: The average energy
intensity of passenger and freight transport is determined by the fleet
composition (number and type of vehicle), the vehicle utilisation
(occupancy rates and load factors) and driving characteristics (speeds,
distances).
Policy and targets
Reduction of energy
(and CO2) intensity is a key measure for reducing total
(fossil) energy consumption and CO2 emissions in the
transport sector. The Auto-Oil Programme aims to improve the energy and
emission efficiency of road transport and to improve the quality of
fuels (see Group 1). A voluntary agreement with the car industry has
been reached to reduce CO2 emissions from new passenger cars
by 25 % (to an average of 140 g/km) from 1995 levels by 2008. The
European Commission has also recently put forward a proposal for an
energy-labelling scheme for new passenger cars (CEC, 1998).
However,
improvements in energy efficiency lead to a decrease in the fuel price
per km, which generally induces more transport use and may therefore
result in increased overall energy consumption. Improvements in fuel
efficiency can be further undermined by decreases in occupancy rates
and load factors and by people buying larger and less fuel-efficient
cars. Making full use of improvements in energy efficiency therefore
requires the use of tax or other policy instruments, to avoid the
improvements being counteracted by increases in vehicle-km or by the
introduction of newer but heavier vehicles.
Currently, most
energy policies are aimed at reducing fuel use per vehicle-km. Some EU
policies (Auto-Oil Programme, Citizens' Network) and demonstration
programmes (SAVE II and THERMIE) also aim, with mixed success, at
boosting the shares of public transport and rail.
At the Member State
level, several countries have targets for reducing fuel consumption.
For example, the target in Austria is to reduce the average fuel
consumption of newly registered cars by 40 % by 2010 and 60 %
by 2020.
Findings
Passenger transport energy
intensity
The fuel efficiency
of new vehicles has improved for all modes. However, changes in the
vehicle fleet (more powerful and heavier cars) and in vehicle
utilisation (decreasing occupancy rates) have absorbed much of the
impact in most countries. As a result, the energy intensity of road and
rail passenger transport has not improved since the beginning of the
1970s (Figure 6.2). This trend is demonstrated for passenger cars in
Box 6.1.
The energy efficiency of air transport
improved significantly during the 1970s, mainly due to technological
improvements and increasing occupancy rates, but has not changed since.
Air passenger travel remains the least energy-efficient
mode.
Research has also shown discrepancies between
"on road" emission rates (i.e. real driving circumstances) and test
emission values, resulting from poor driving behaviour, worsening
traffic conditions and other problems, not generally taken into account
in policy making. This emphasises the need for regular maintenance and
inspection programmes (MEET, 1999).
Freight transport energy
intensity
The changes in energy intensity of road freight (Figure 6.3) have
different causes. The energy intensity of trucks of a given size has
fallen in every country, with the increased penetration of diesels and
general technical improvements in diesel or petrol trucks. But the
ratio of fuel used to freight hauled has not fallen in all countries,
and varies considerably between countries. With production dominated by
large, international firms, the differences are not due to differences
in the energy efficiency of trucks, but arise mainly from differences
in fleet mix (between large, medium, and light trucks), traffic, and
above all in loading and utilisation (Schipper, et al., 1997, see also
Indicators 22-23).
Figure 6.3: Energy
intensity of road freight transport
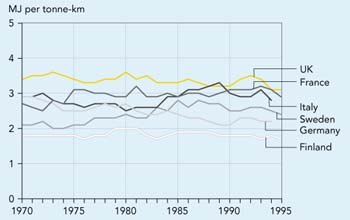
Source:
International Energy Studies, Lawrence Berkeley Laboratory, as compiled
from recognised national sources
The usage of trucks is also increasingly governed
by the need for just-in-time deliveries, the rising value (as opposed
to tonnage) of freight, and the importance of costs other than fuel
cost. The potential for improving the energy efficiency of road freight
transport is discussed in Box 6.2.
|
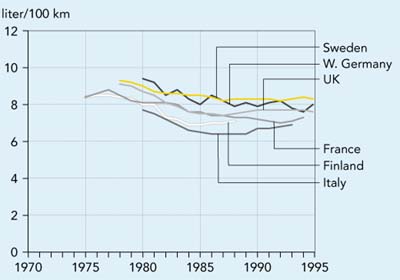
Box 6.1:
Fuel efficiency of new cars versus energy intensity of passenger car
transport
Figure a) shows how
test values for the fuel efficiency of new cars have decreased over the
years, mainly due to a significant decrease in the ratio of new-car
fuel intensity to weight (IEA, 1997). However, much of the technology
benefit has been lost by people buying heavier and more powerful cars.
As a result, there has only been a slight improvement in fuel
consumption for the average car fleet (Figure b). In addition,
decreasing occupancy rates of passenger cars have further offset fleet
improvements. So, energy use per passenger-km has not improved during
recent decades (Figure c).
|
Figure 6.4:
Fuel efficiency: and energy intensity
a) Fuel efficiency
of new cars
b) Fuel efficiency
of total fleet
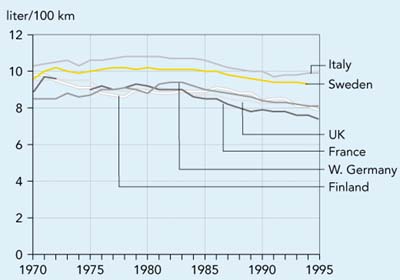
c) Energy intensity
of car passenger transport
Source: International Energy
Studies, Lawrence Berkeley Laboratory, as compiled from recognised
national sources
|
Box 6.2:
Improving fuel efficiency in road freight transport
A recent OECD, ECMT,
IEA workshop evaluated the potential for emission reductions through
improving fuel efficiency in truck technology, changes in freight
systems logistics (inter-modality, spatial organisation, traffic
management) and notably behavioural and organisational improvements to
reduce fuel consumption.
The key findings
were that, at least in the short to medium term, the potential
improvements from greater awareness of the need for energy efficiency
and organisational measures outweigh the potential for technological
improvements. Potential fuel efficiency improvements are estimated at
about 5 % for vehicle technology improvements, 5-10 % for
driver training and monitoring and more than 10 % for the other
fleet management and logistics measures as a whole.
Source: OECD/ECMT, 1999
|
Future work
- Harmonised EU data on energy and fuel
intensity for various transport modes and vehicles is not currently
available. Data from a study by the Lawrence Berkeley Laboratory on
behalf of the International Energy Agency has been used
instead.
- In the long term, the joint DG
Transport-Eurostat TRENDS project (drawing on COPERT methodology and
MEET results - see Box 6.4) will provide data for this
indicator.
- An indicator on primary energy intensity
would provide a better basis for comparing modes, mainly because it
would take account of energy used for the production of electricity and
fuels, and for the production and disposal of vehicles. This would,
however, require extensive methodological development and data
collection.

Document Actions
Share with others