Indicator 19 (and 17): Internalisation of external
costs
- Although there are many methodological problems,
it is estimated that in 1991 only about 30 % of road infrastructure
and external costs were recovered from users and only about 39 %
for rail.
- Internalisation of transport costs is expected
to lead to efficiency improvements, while non-transport taxes should
decrease as a result of external costs being transferred from government
to transport users. The impact on GDP growth or industrial competitiveness
should, again in principle, therefore be small.
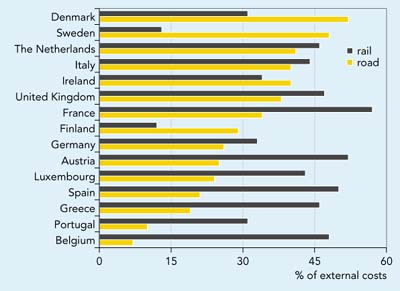
Figure 5.8: Proportion of external and infrastructure
costs covered by revenues in transport (1991)

Source: EEA, 1999b, using data from
UIC, 1994 and ECMT, 1998
Objective
Recover the full costs of transport
including externalities from users.
Definition
The proportion of external costs that
are covered by revenues from relevant taxes and charges.
Note: External costs are those that transport
users inflict on others, such as noise, air pollution, accidents, climate
change, congestion, and infrastructure costs. With improvements in data
and method they could also include the use of land, solid waste generation,
water pollution, fragmentation of human and animal communities, and the
aesthetic impacts of infrastructure and traffic.
|
Policy and targets
An important aspect of the EU transport
policy is the concept of fair and efficient pricing, described in the Commission
Green Paper on Fair and Efficient pricing (CEC, 1995). This proposes to apply
the polluter-pays principle to ensure that transport users pay all the costs
they impose on others. External costs should be recovered via taxation, and
these taxes should be differentiated according to the environmental performance
of each mode.
Internalisation is a policy instrument
to correct market imperfections and the resulting inefficient allocation of
resources that can occur when costs are not borne by those who incur them. Internalisation
of external costs such as those related to air pollution, noise and accidents
should also reduce the environmental costs of transport by providing incentives
to reduce demand.
It is widely accepted that transport prices
do not recover external costs, but there is less agreement about the extent
of the shortfall. Any move towards internalising costs should however produce
significant social and community benefits. The recent ECMT report on policies
for internalisation concludes that the main response to internalisation is likely
to be significant technological and operational efficiency improvements. The
overall effect on demand for mobility and modal shares is likely to be relatively
small. But the increase in transport costs will be offset by efficiency improvements
and there will be opportunities for reducing non-transport-related taxes. So
the impact on GDP growth or industrial competitiveness is likely to be small
(ECMT, 1998).
Findings
The external costs of transport in the
EU caused by environmental damage (noise, local air pollution, and climate change)
and accidents are estimated to be around 4 % of GDP (ECMT, 1998).
In 1991, cost recovery (Figure 5.8) was
generally higher for rail (39 %) than for road transport (30 %) (with
the exception of the Nordic countries and Ireland). This is partly due to rail
infrastructure subsidies being used to encourage greater use of rail transport.
Overall, the degree of internalisation remains below 50 %. The highest
cost recovery rates are found in France, Austria, Denmark and Spain, while Belgium
and Portugal show the lowest.
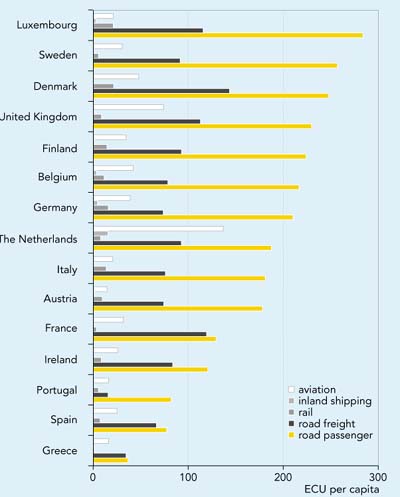
It is estimated (see Figure 5.9) that of
total EU external transport costs:
- road traffic accounts for about 83 %;
- aviation for about 13 %;
- rail for about 3 % (Germany, Italy, the United
Kingdom and Spain dominate with three-quarters of this);
- inland shipping for about 1 % (only significant
in Germany and the Netherlands).
Figure 5.9: External costs of transport per capita
(1991)

Source: UIC, 1994
Currently, it is impossible to calculate internalisation
percentages for inland shipping and aviation, as data on taxes and charges is
not available. Also no levies are imposed on the River Rhine, which includes
the bulk of inland navigation in the EU. Similarly, aviation is exempt from
excise duties and VAT.
Finally, another important issue in considering the
policy of internalisation is the role of public transport subsidies. In the
short term, before full internalisation has been achieved, subsidies can provide
another way of promoting less environmentally harmful transport modes. Some
governments subsidise passenger train services in order to provide an alternative
to car transport and to help ensure social equity.
|
Box-5.3: Peak car reference prices and costs
In the TRENEN II STRAN research project urban and interregional models
were developed to assess pricing reform in transportation in the European
Union. The models were applied in six urban case studies and three interregional
case studies.
Although some methodological and data problems remain, the project findings
shows that the discrepancy between current prices and external costs in
congested urban conditions are often considerable. Figure 5.10 gives,
for some of the case studies and for 2005, the expected generalised prices
and marginal social costs of a small petrol car driven in the peak period
by a lone inhabitant who does not pay for his parking at destination.
The figure shows that peak car use covers only one-third to half of its
full marginal costs. There are two main sources of error: unpaid parking
and the omission of some external congestion costs (e.g. the time costs
that each user imposes on others). Unpaid parking distorts prices in the
peak and off-peak. Its importance varies across cities: parking costs
are much higher in London and Amsterdam than in Brussels and Dublin. The
external costs shown in the figures cover congestion air pollution, accidents
and noise.
In the inter-urban passenger transport case studies (results for Belgium
and Ireland in the figure), the difference between current taxes and charges
and external costs were found to be less important than for urban transport.
Figure 5.10: Peak car reference prices and costs (expected situation
for 2005 with unchanged pricing policies)

Source: TRENEN II STRAN ST 96 SC 116 - Final Summary Report
Note: The generalised price (left block for each city/country)
includes the resource costs (except parking), taxes and own-time costs.
The generalised marginal social cost (right block) includes resource costs,
parking resource costs, own-time costs and marginal external costs.
|
Future work
- Problems in analytical method and data shortcomings
make estimates of external costs and the degree of internalisation uncertain.
These must be overcome to improve this indicator.
- The environmental costs of water and soil pollution,
vehicle production and disposal pollution, effects on ecosystems, visual annoyance
and splitting communities with transport infrastructure are inadequately covered
and methods of estimating them need to be improved.
- The estimates for climate change include many uncertainties
and do not allow for NOx and CO2 emissions from aircraft.
The external costs of aviation are therefore underestimated.
- The environmental impacts of maritime shipping are
not included because of gaps in data and definition problems.
- An update of the IWW/INFRAS study (UIC, 1994) is
being prepared to improve understanding of the magnitude of external costs
in Member States.
- The European Commission has outlined plans to develop
methods of calculating the external and internal costs of transport (CEC,
1998d).
- At present, data on subsidies (i.e. TERM Indicator
17) is not collected in a way that enables an EU-wide indicator to be quantified.
Such an indicator is likely to show wide variations in subsidy policy and
level across the EU.
|
Data
Proportion of external and infrastructure costs covered by revenues in
transport, 1991
Unit: million ECU for cost data and %
for recovery rate
|
| |
External costs
|
Infrastructure costs
|
Total costs
|
Revenues
|
Cost recovery
rate (%)
|
| |
road
|
rail
|
road
|
rail
|
road
|
rail
|
road
|
rail
|
road
|
rail
|
|
Austria
|
6 665
|
112
|
3 713
|
1 283
|
10 378
|
1 395
|
2 613
|
729
|
25.2
|
52.3
|
|
Belgium
|
8 680
|
126
|
1 152
|
600
|
9 832
|
726
|
664
|
351
|
6.8
|
48.3
|
|
Denmark
|
3 424
|
120
|
1 338
|
171
|
4 762
|
291
|
2 467
|
90
|
51.8
|
30.9
|
|
Finland
|
3 208
|
94
|
3 068
|
283
|
6 276
|
377
|
1 829
|
46
|
29.1
|
12.2
|
|
France
|
34 998
|
335
|
22 853
|
4 265
|
57 851
|
4 600
|
19 407
|
2 604
|
33.6
|
56.6
|
|
Germany
|
61 846
|
1 445
|
25 049
|
4 724
|
86 895
|
6 169
|
22 583
|
2 008
|
26.0
|
32.5
|
|
Greece
|
3 240
|
29
|
687
|
112
|
3 927
|
141
|
756
|
65
|
19.3
|
46.1
|
|
Ireland
|
1 572
|
35
|
800
|
48
|
2 372
|
83
|
955
|
28
|
40.3
|
33.7
|
|
Italy
|
34 795
|
832
|
20 649
|
2 439
|
55 444
|
3 271
|
22 288
|
1 424
|
40.2
|
43.5
|
|
Luxembourg
|
340
|
9
|
284
|
28
|
624
|
37
|
149
|
16
|
23.9
|
43.2
|
|
Netherlands
|
7 829
|
139
|
4 142
|
522
|
11 971
|
661
|
4 920
|
305
|
41.1
|
46.1
|
|
Portugal
|
5 445
|
118
|
676
|
133
|
6 121
|
251
|
590
|
78
|
9.6
|
31.1
|
|
Spain
|
20 702
|
293
|
7 082
|
1 718
|
27 784
|
2 011
|
5 934
|
1 003
|
21.4
|
49.9
|
|
Sweden
|
5 527
|
69
|
2 947
|
5 216
|
8 474
|
5 285
|
5 047
|
690
|
47.9
|
13.1
|
|
United Kingdom
|
38 508
|
538
|
13 142
|
2 132
|
51 650
|
2 670
|
19 750
|
1 245
|
38.2
|
46.6
|
|
EU15
|
236 779
|
4 294
|
107 582
|
25 255
|
344 361
|
29 549
|
109 952
|
10 682
|
30.3
|
39.1
|
Note: external
costs include cost of accidents
Source: EEA, 1999 using data from UIC, 1994 and ECMT, 1998 |


Document Actions
Share with others