Indicator 9: Freight transport
|
Changes in production and supply systems, increasing distances and low
load factors (empty runs still account for around 30 % of total
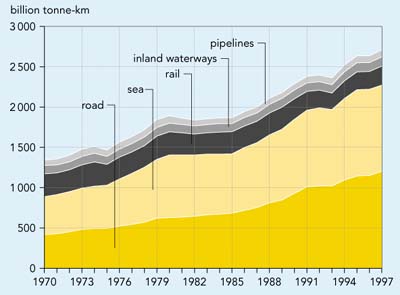
vehicle-km) have resulted in a doubling of tonne-km between 1970 and 1997,
with the largest annual growth in road (4 % on average) and short-sea
shipping (3 %). Freight transport is shifting increasingly towards
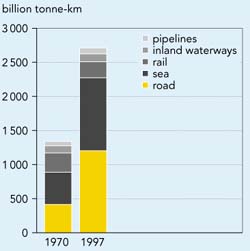
road: trucking now accounts for 45 % of total freight transport
(30 % in 1970). While the Communitys freight transport action plans
have resulted in a better performance of short-sea shipping, they have
not yet reversed the decline in shares of rail and inland waterways.
Figure 2.4: Annual passenger transport performance by mode (EU)

Sources:
DG Transport, Eurostat
Objectives
- Reduce the link between economic growth and freight transport demand.
- Improve the shares of rail, inland waterways, and short-sea shipping
modes.
Definition
- Tonne-km carried by each transport mode (road, rail, air, inland waterways,
sea).
Note: Adjusting this indicator by GDP provides a possible measure
of transport intensity passenger-km relative to GDP. This indicator
can monitor progress in reducing the coupling between economic activity
and transport demand.
|
Policy and targets
Freight transport demand is closely connected to changes
in the volume and structure of economic activity. Changes in industrial structures,
production/distribution organisation and logistics (including just-in-time delivery),
have also increased demand. The strong growth in road transport results from
its speed and flexibility in meeting such changes, and also its ability to service
out-of-town factories and shopping centres. Even when other modes are used,
road transport is often needed for the initial and final stages of the journey
to the point of loading or unloading. Rail has become less and less attractive,
because of the decline in quality and flexibility offered. These trends are
further enhanced by the continuing investment in road transport infrastructure
over rail and inland waterways (see Indicator 13).
The Communitys freight strategy focuses mainly on the
promotion of intermodal and combined transport, the revitalisation of railways,
inland waterways and shipping. The trans-European transport network is again
a main element in this strategy. No quantified EU targets for freight transport
demand or modal split have been established, and only a limited number of Member
States have set targets.
Findings
Figure2.5: Changes in freight transport modal
split (EU)

Sources: DG Transport,
Eurostat
Total annual tonne-km increased by 102 % over
the period 1970-1997, an average annual increase of 2.6 %. Over the same
period, GDP (at 1990 constant prices) grew at an average of 2.5 % per
year. In the periods 1979-1985 and 1990-1993 the growth in freight transport
was low or negative, reflecting the economic climate. The main growth in freight
tonne-km has been in the transport of wood, paper pulp, chemicals, and manufactured
products such as glass and ceramics, and machinery.
The largest increases have been road (4.0 % per
year) and short-sea route shipping (3.1 % per year). Rail transport has
declined by 0.6 % per year, while pipeline and inland waterways have grown
a little (1.0 % and 0.4 % per year respectively). On the other hand,
the total tonnage carried has increased less rapidly than tonne-km, because
average distances travelled have increased.
Growth in freight transport has been especially pronounced
in Greece and Portugal. Both countries have more than tripled the total tonne-km
carried since 1970 and they remain among the Member States with the largest
rates of increase. On the other hand, tonne-km in Ireland has increased only
slightly since 1970, and has remained on the same level over the past decade.
Between 1970 and 1997 the share of road haulage rose
significantly from 31 to 45 %. Short-sea shipping rose from 35 to 39 %
and is the only other mode of transport, which has increased its share. The
change in modal choice from 1970 to 1997 shows a long-term trend towards roads
at the expense of rail and inland waterways. Austria and Sweden are the only
Member States where a significant share of freight transport is carried by rail.
In both countries more than one-third of freight is transported by rail.
While traditional rail has been declining, combined
road/rail transport has shown significant growth rates in recent years (7 %
per year from 1985-1996). Already, according to DG Transport, about 50 bn tonne-km
or 23 % of total tonne-km of EU rail freight is carried on combined road/rail
services. Combined transport also represents a high share of rail freight in
Italy (40 % of total tonne-km), Spain (34 %) and the Netherlands
(30 %).
Increasing intra-EU trade and internationalisation has
also led to an increase in the share of international freight tonne-km, mainly
by sea and road transport. International transport accounts for 50 % of
total tonne-km (and 10 % of total transported tonnes). Transit traffic
(i.e. traffic that crosses a certain country but has a destination and origin
in another different country) represents 7 % of EU land transport performance
(see Box 2.2).
Under the EEAs business as usual scenario a 50 %
increase in tonne-km by 2010 is expected (over 1994). This would mainly arise
from an increase in international freight movements. Rails share in overall
demand is expected to increase slightly, particularly for long distances, as
a result of encouraging combined road-rail transport.
|
Box 2.2: Transit freight transport through Austria and the eco-point
system
Transit freight is concentrated on relatively few routes, all of which
have very high transport volumes. It is a particular problem in the Alpine
region where a large proportion of international freight traffic passes
through especially sensitive areas, and where transit transport has increased
substantially during recent decades. Austria saw a tenfold increase in
transit freight transport across the Brenner Pass between 1960 and 1996
and at the same time the road/rail market shares were almost reversed.
In 1960 the market share for rail was 87 %, but by 1996 it was down
to just 30 %. A shift of transit road freight to rail transport
is therefore an essential cornerstone of the Austrian environment and
transport policy. To achieve such a shift requires measures at the trans-national
level.
One of the instruments Austria is using to abate NOx emissions
from fright transport is the eco-point system. This started in 1992 (as
agreed in Austrias Accession Treaty) and aims to reduce emissions by
60 % by the year 2003. Annually a limited number of eco-points are
attributed to each country in the Community. Each heavy goods vehicle
(weighing more than 7.5 tonnes, and registered in the Community) has to
pay a number of eco-points for each transit trip through Austria. The
number of eco-points depends on the emission characteristics of the truck
and the distance travelled.
An interim evaluation of the eco-point system was made by the Commission
in 1998. This shows that the system is effective: average NOx emissions
from trucks fell by 27 % in four years and total emissions from
transit are declining. Of course there is no evidence that such improvement
is due solely to the eco-point system, but it can be assumed that the
system has provided an important incentive. A next review of progress
towards the target will be made (by the Commission and the EEA) in January
2001. Depending on the findings of this evaluation the system can be continued
for an extra three years.
Source: (BMU, 1997), (CEC, 1998a)
|
Future work
More work is needed to develop reliable and comparable
statistics on tonne-km by modal split and type of goods carried.
|
Data
Freight transport demand
Unit: bn tonne-km
|
| |
1970
|
1980
|
1990
|
1992
|
1993
|
1994
|
1995
|
1996
|
1997
|
|
Austria
|
21.7
|
29.8
|
32.6
|
33.7
|
33.7
|
36.1
|
36.9
|
38.0
|
40.0
|
|
Belgium
|
50.0
|
69.2
|
94.2
|
99.8
|
97.3
|
106.9
|
109.1
|
104.2
|
105.9
|
|
Denmark
|
22.3
|
27.3
|
32.6
|
36.6
|
35.3
|
38.7
|
39.9
|
41.0
|
41.4
|
|
Finland
|
77.5
|
99.8
|
118.6
|
120.9
|
123.1
|
130.1
|
134.5
|
137.6
|
139.9
|
|
France
|
213.0
|
293.1
|
355.1
|
368.9
|
354.6
|
379.6
|
401.3
|
397.8
|
410.6
|
|
Germany
|
316.4
|
400.5
|
420.6
|
467.6
|
463.4
|
501.4
|
513.7
|
509.8
|
535.4
|
|
Greece
|
17.7
|
56.9
|
68.0
|
71.4
|
65.6
|
68.6
|
78.2
|
78.9
|
79.5
|
|
Ireland
|
15.6
|
12.0
|
14.6
|
15.1
|
15.6
|
16.8
|
17.6
|
17.8
|
17.8
|
|
Italy
|
169.8
|
278.5
|
360.8
|
374.9
|
364.4
|
381.7
|
397.2
|
402.9
|
414.4
|
|
Luxembourg
|
1.3
|
1.6
|
2.2
|
2.6
|
2.7
|
2.6
|
2.7
|
2.7
|
2.8
|
|
Netherlands
|
88.6
|
132.6
|
155.8
|
165.5
|
158.8
|
169.3
|
175.2
|
177.5
|
184.5
|
|
Portugal
|
13.6
|
29.1
|
36.9
|
38.5
|
36.4
|
41.1
|
43.5
|
40.9
|
41.6
|
|
Spain
|
78.2
|
134.2
|
186.7
|
198.1
|
194.0
|
206.3
|
224.6
|
218.8
|
224.4
|
|
Sweden
|
47.7
|
59.3
|
69.5
|
69.2
|
70.8
|
75.0
|
78.3
|
80.2
|
82.4
|
|
United Kingdom
|
203.4
|
266.9
|
339.6
|
335.5
|
346.0
|
369.4
|
381.9
|
389.7
|
393.5
|
|
EU15
|
1336.8
|
1890.9
|
2287.8
|
2398.3
|
2361.7
|
2523.6
|
2634.6
|
2637.9
|
2714.0
|
Source:
Eurostat, DG Transport
Note: The data has been drawn from the DG Transport statistics pocketbook
(version 1999). This combines data from Eurostat, the European Conference
of Ministers of Transport (ECMT), and other sources, together with additional
data supplied by the Member States. |


Document Actions
Share with others