Indicator 6: Land take
|
Land is under continuous pressure for new transport infrastructure: during
1990-1996, a total of some 25 000 ha, about 10 ha of land every day,
were taken for motorway construction in the EU.
Figure 1.16: Average daily land take by new motorways (EU)
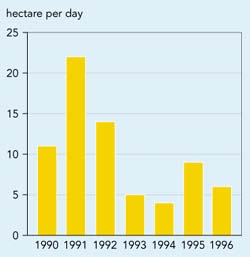
Source: Eurostat
Objective
Minimise land take per transport unit.
Definition
Annual land take by transport mode, including direct land take (i.e.
area covered by the transport infrastructure) and indirect land take (associated
land take for security areas, junctions and service areas, stations, parking,
etc.).
|
Policy and targets
Land resources in much of Europe are relatively scarce,
and achieving a sustainable balance between competing land uses is a key issue
for all development policies. New initiatives, such as the European Spatial
Development Perspective, are specifically addressing the spatial impact of policies
(including transport) on the European territory.
Land taken by transport is withdrawn from other uses.
Land take in natural areas may lead to a decrease of biodiversity, as may fragmentation
by linear infrastructures such as roads, railways or canals (see Indicator 5).
Take of agricultural or forestry land may have harmful environmental effects
(e.g. visual impact on landscapes) as well as socio-economic impacts.
There are few quantitative targets for this indicator.
The Common Transport Policy advocates an optimal use of existing infrastructure,
and some Member States have developed land-use policies and plans that restrict
additional transport developments in certain areas.
In Germany, a land-take target of 30 ha per day by 2020
(compared to 120 ha per day in 1997) has been proposed for the Environment-Barometer
indicator . increase per day in area covered by human settlements and traffic
routes.
Findings
There is little data available on annual land take by different
transport modes. Total land take so far (direct plus indirect) per transport
mode in each Member State is shown in Figure 1.17. Transport infrastructure
covers 1.2 % of the total available land area in the EU. Road transport
is by far the main consumer of land for transport. The road network (motorways,
state, provincial and municipal roads) occupies 93 % of the total area
of land used for transport in the EU15. Rail is responsible for only 4 %
of land take. Airports in Europe (including military airports) occupy over 1
500 km² (1 %), slightly more than the area covered by canals for water
transport.
Figure1.17: Total land take by transport infrastructure
(1996)
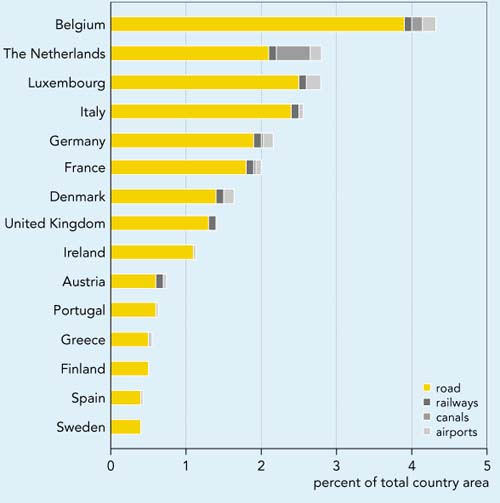
Source: Eurostat, EEA
Land-take efficiency (the ratio between land used and the infrastructure. s
traffic carrying capacity) varies strikingly from one infrastructure type to
another. For example, compared to road transport, railways require the lowest
land take per transport unit (i.e. passenger-km and tonne-km): land take per
passenger-km by rail is about 3.5 times lower than for passenger cars (IEEA,
1999b).
The potential environmental impact of transport infrastructure depends strongly
on the type of land affected (including its immediate surroundings). Figure
1.18 shows that road and rail infrastructure withdraws land mainly from agricultural
use and to a lesser extent from built-up areas. The share of land take in semi-natural
areas and wetlands is slightly more for roads than for railways. Other important
factors are the infrastructure characteristics, which determine, for example,
the visual impact on the landscape and the extent to which the infrastructure
constitutes a barrier hampering the movement of animals or people.
Disused railway land is a valuable resource. Its reuse (e.g. as nature area,
walking or cycling paths) provides an important development opportunity with
considerable environmental implications. After returning this land to nature,
its success as a terrestrial habitat may depend upon the implementation of protection
or management measures for particular species (Carpenter, 1994).
Figure 1.18: Land take by roads and railways (including their immediate
surroundings) according to land-cover type (EU, 1997)
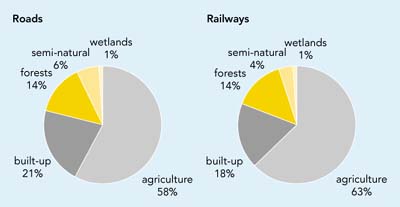
Source: EEA
Future work
- To compare modes, land take needs to be linked to the traffic capacity of
each mode. This requires data (length according to various infrastructure
types, width, geographic location, etc.) that is currently not regularly collected
by Member States.
- Land cover types are inventoried through the European CORINE land cover
programme, which is to be updated every 10 years (during which time a 2 to
5 % change in land cover can be expected). Collection of data on new
transport infrastructure (causing land take) by Member States may be required.
|
Data
Table 1.5: Direct and indirect land take by transport
|
|
Infrastructure type
|
Land take (ha / km)
|
| |
direct
|
direct + indirect
|
|
Road
|
motorway
|
2.5
|
7.5
|
| |
state road
|
2
|
6
|
| |
provincial road
|
1.5
|
4.5
|
| |
municipal road
|
0.7
|
2
|
|
Rail
|
conventional and high-speed
|
1
|
3
|
|
Water
|
canal
|
5
|
10
|
|
Air
|
|
none (runways not considered)
|
airports
|
Source: EEA-ETC/LC
Note: Estimates for motorways and high-speed train lines (based on
assumptions about the number of lanes or tracks and their average width)
may be of variable quality, for example they may not take account of associated
facilities such as garages, filling stations and parking areas. |

Document Actions
Share with others