Indicator 3: Exceedance of air quality standards
|
Although air quality has improved in recent decades (and particularly
in the large urban areas), nearly all urban citizens still experience
exceedances of EU urban air quality standards.
Figure 1.9: Urban population potentially exposed to exceedances of
(proposed) EU urban air quality standards (EU, 1995)
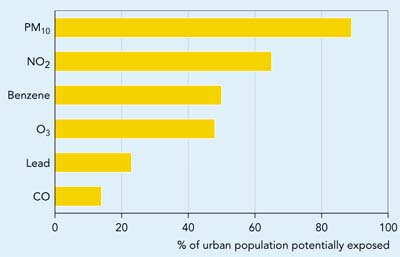
Note: Figure indicates . potential exposure. as estimates are
based on the assumption of exposure for a person permanently in ambient
air (i.e. not taking into account the indoor exposure).
Note: PM10 is the fraction of suspended particulate matter
sampled with sizxe-selecting device with a 50% efficiency at an aerodynamic
particle diameter of 10 micrometer.
Source: EEA, ETC/AQ (2000)
Objective
- Meet EU air quality standards (see Table 1.2).
Definition
- Exceedances of EU air quality standards for benzene (C6H12),
carbon monoxide (CO), lead (Pb), nitrogen dioxide (NO 2), ozone (O 3) and particulate matter (PM 10).
- Population exposed to exceedances of (proposed) EU urban air quality
standards.
Note: Measured values were found to have insufficient spatial
coverage to estimate potential exposure to air pollution of the urban
population in the EU. Exceedances of limit values were therefore calculated
using a model developed in the Auto-Oil II programme (EEA, 2000). By combining
calculated values and population data, an estimate was made of potential
exposure, i.e. the exposure of people if they are in ambient air 24 hours
a day.
|
Policy and targets
The transport sector is a major source of air pollution,
and the dominant source in urban areas, having overtaken the combustion of high-sulphur
coal, oil and industrial combustion processes. Exposure to air pollution can
cause adverse health effects, most acute in children, asthmatics, and the elderly
(WHO/EEA, 1997), and can damage vegetation (foliar injuries and reductions in
yield and seed production) and materials (notably, the cultural heritage).
Within the transport sector, road traffic is the most
important contributor to urban air pollution. While national and EU regulations
aimed at automobile emission reductions (such as the introduction of catalytic
converters or unleaded petrol) have resulted in considerably lower emissions
per vehicle, the continuous expansion of the vehicle fleet is partly offsetting
these improvements (see Indicator 2).
Community policies to curb air pollution from road traffic
have been framed around the Auto-Oil Programme I (which is now completed) and
the Auto-Oil Programme II, with its proposed follow-up programme . Clean Air
for Europe. . At the international level, various protocols under the Geneva
Convention on Long Range Transboundary Air Pollution (CLRTAP) set emission reduction
targets for specific pollutants in the form of National Emission Ceilings based
on a cost-effectiveness analysis. The Commission has proposed slightly
stricter National Emission Ceilings based on its acidification and ozone abatement
strategy. The United Nations Framework Convention on Climate Change is also
relevant since measures to reduce emissions of greenhouse gases from fuel consumption
will at the same time reduce emissions of other compounds.
Several air quality limit values for ambient concentrations
have been set to protect human health. Current EU legislation (the EC Framework
Directive on Ambient Air Quality and management (CEC, 1996a) and related daughter
Directives) is based on WHO-recommended threshold values.
|
Table 1.2: Environmental objectives under the Auto-Oil Programme II
|
|
Pollutant
|
Averaging period
|
Air quality standards and objectives
|
Legal status
(see notes)
|
|
NO2
|
1 hour
|
200 µg/m3 not to be exceeded more than 8 (18) times a calendar
year
|
1
|
|
NO2
|
calendar year
|
40 µg/m3
|
1
|
|
PM10
|
24 hours
|
50 µg/m3 not to be exceeded more than 7 (35) times a calendar
year
|
1
|
|
PM10
|
calendar year
|
20 µg/m3 (40µg/m3 )
|
1
|
|
CO
|
8 hours
|
10 mg/m3
|
2
|
|
Ozone
|
daily 8-h max
|
120 µg/m3 not to be exceeded more than 20 days per calendar
year
|
3
|
|
Benzene
|
calendar year
|
5 µg/m3
|
2
|
|
Lead
|
calendar year
|
0.5 µg/m3
|
1
|
|
Note:
- Proposed daughter Directive agreed in Council (OJ, C360/99, 23/11/98)
(some of these values have been amended in the recently adopted daughter
Directive 1999/30/EC, indicated in brackets)
- Commission Proposal COM (98) 591
- Commission Proposal COM (99) 125
|
Findings
Although air quality in Europe (and particularly in
the large urban areas) has improved in recent decades, nearly all urban citizens
still experience exceedances of the limit values listed in Table 1.2
(Figure 1.9). About 90 % of the urban population experience exceedances
of both the 24 h and annual average EU objectives for particulate matter. Exposure
to exceedances of NO2, benzene and ozone are also frequent.
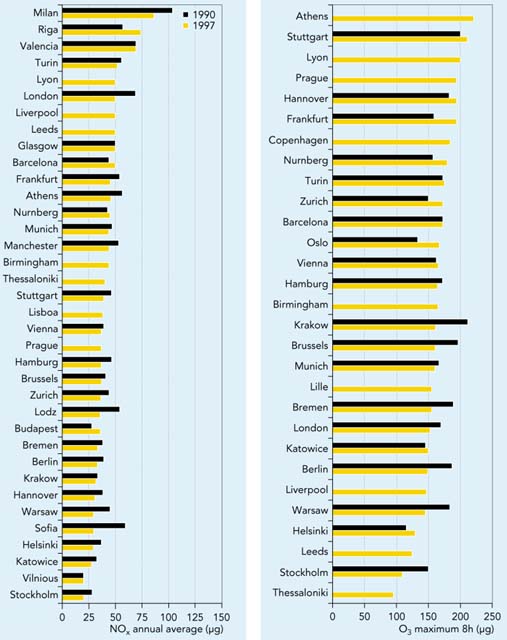
Figure 1.10: Annual average NOx and maximum
8-hour O3 concentrations for a number of large European cities
Source: EEA-ETC/AQ (2000)
Nitrogen dioxide (NO2)
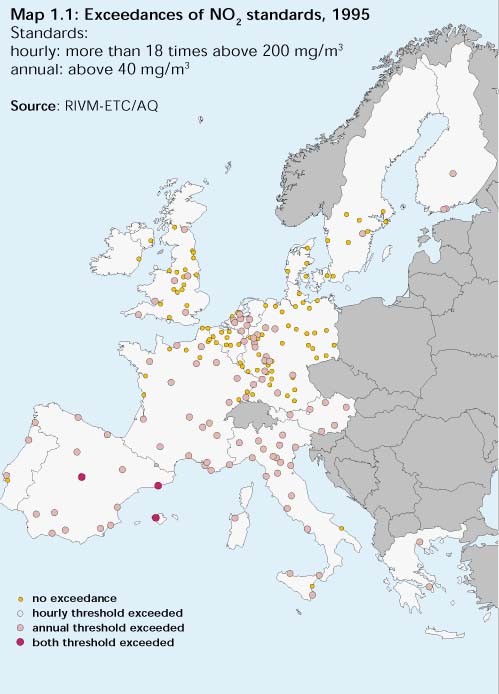
The EU air quality limit values were exceeded in
1995 in most European cities, however peak concentrations are decreasing. In
most larger cities the average city background concentrations, representative
for the urban area at large, exceeded EC proposed limit values (Figure 1.10).
From the limited data, the highest concentrations appear to occur in some southern
European cities (Map 1.1).
Source: RIVM-ETC/AQ
Benzene
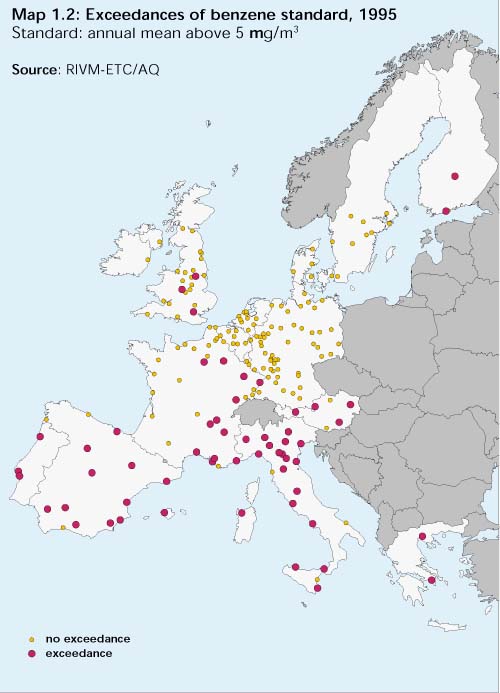
In 1995 about half the urban population of the EU was exposed to benzene
levels in excess of the proposed EU limit value. The largest exceedances are
found at street level and in car parks. Validation of the benzene calculations
with measurements is hampered, partly by the scarcity of data (none of the EEA
member countries has submitted benzene data to the European database AIRBASE
) and partly because measurements are frequently made at stations near traffic
routes whereas the calculations are intended to be representative of the overall
urban environment. Nevertheless, there is reasonable agreement with measurements.
Exceedances most often occur in the more southern countries (Map 1.2). The highest
contribution of traffic to total benzene emissions is also found in these countries.
Source: RIVM-ETC/AQ
Carbon monoxide (CO)
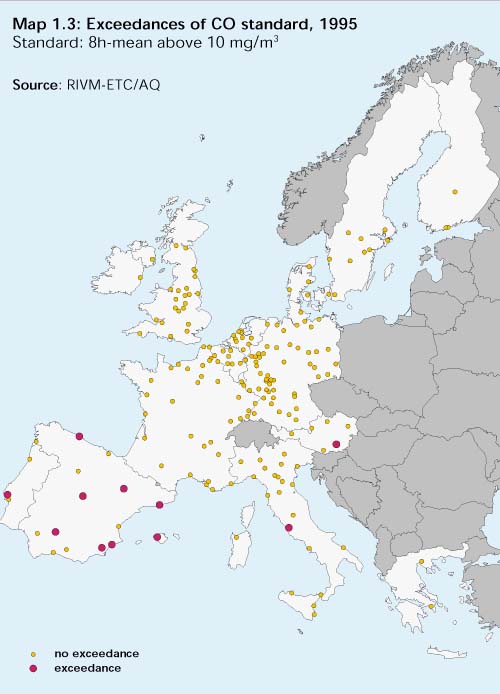
Urban air concentrations have clearly fallen during the past decade. Exceedances
of the objective (8-hour average of 10 mg/m3) have been calculated
for 11 cities (14 % of the total urban EU population in all the cities
that were included in the modelling). Most exceedance were found in the southern
Europe cities (Map 1.3).
Source: RIVM-ETC/AQ
Particulate matter (PM10)
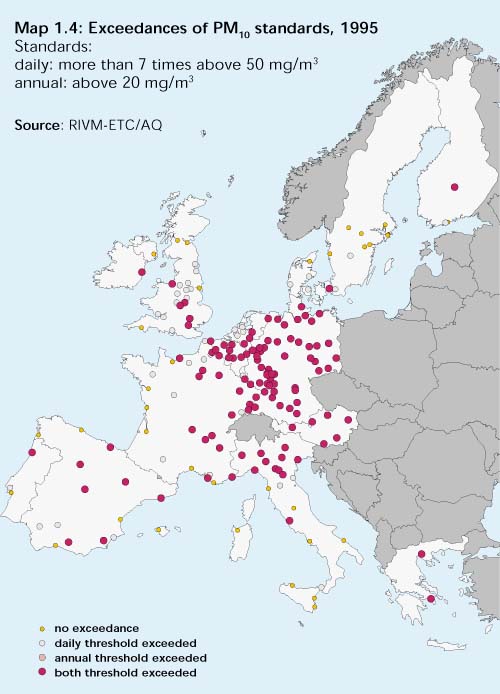
The EU limit values (both for the annual and for
the daily PM10 concentrations) are frequently exceeded by a large
margin (Map 1.4). Data is currently insufficient to draw firm conclusions about
emission trends. However, concentrations of total suspended particulates (TSP)
and black smoke are generally decreasing. PM10 concentrations are
expected to remain well above limit values in most urban areas of EEA member
countries in the coming decade. This suggests that more measures need to be
taken to reduce human health risks significantly (CEC,1999c).
Source: RIVM-ETC/AQ
Ozone
Episodes of ozone exceedance occur over most parts of
Europe every summer. The reduction in emissions of ozone precursors (NOx,
NMVOC) achieved in the EU has not yet been sufficient to make a significant
difference to health risk. Threshold values set for the protection of human
health and vegetation are frequently exceeded by a large margin (Figure 1.10).
Insufficient data and strong year-on-year fluctuations owing to episodes of
high ozone concentrations preclude clear conclusions on time trends. However,
the limited monitoring data suggests that peak concentrations are decreasing.
Despite projected further emission reductions, ozone
concentrations are expected to exceed EC threshold values over all EEA member
countries in the next decade (EMEP, 1999). By 2010, north-western European
areas are expected to comply with the proposed EU target value of only 20 exceedance
days per year in the long-term air quality objective (CEC, 1999a).
Lead
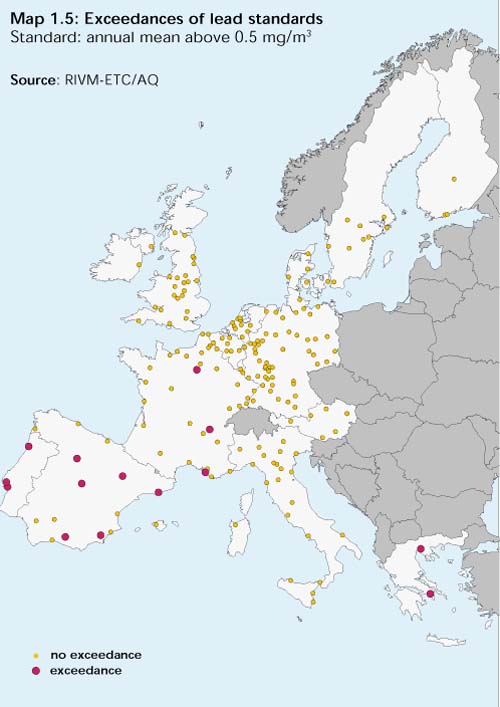
Urban lead concentrations have decreased in the past
decade. In 1990, 23 % of the EU urban population could have been exposed
to ambient levels in excess of the limit value of 0.5 m g/m3 annual
average, as estimated from the cities covered by the calculations (Map 1.5).
Source: RIVM-ETC/AQ
Future work
While the transport sector is an important source of many
of the pollutants discussed above, the same pollutants also come from many other
sectors. No data is currently available on the relative sectoral contributions
to air pollutant concentrations. However, the EEA. s Generalised Empirical Approach,
which is being developed and applied in the context of the . Clean Air For Europe.
programme, has provided a methodology for estimating the transport contribution
to urban air pollution.
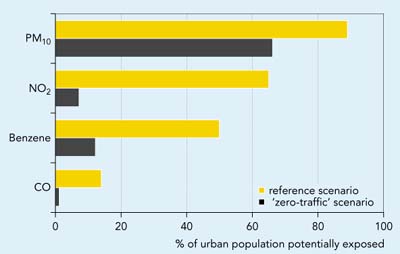
Figure 1.11 shows some preliminary results using this methodology,
assuming zero pollution from road transport in a given city. Under this assumption,
exceedances of threshold values for typical transport-related pollutants like
NO2, CO and benzene would decrease dramatically, but there would
be less impact on PM10 levels, most of which result from particles
transported over long distances.
Figure 1.11: Urban population potentially exposed to
exceedances of (proposed) EU urban air quality standards under a 'zero traffic'
scenario (EU) Preliminary results (reference year 1995)
Source: EEA, ETC/AQ (2000)


Document Actions
Share with others