2. Data Reporting
2.1 Introduction
According to the Ozone Directive, the EU Member States have to provide
the following information for the annual reference period:
- maximum, median and 98 percentile value of 1h- and 8h- average ozone
concentrations;
- the number, date and duration of periods during which threshold values as
presented in Table 1 are exceeded and the maximum concentrations recorded during each
occurrence.
In addition to this annual report, Member States must inform the
Commission on a monthly basis in case exceedances of the information and warning threshold
values are observed. In this report only data reported on an annual basis will be
considered.
Table 1. Threshold values for ozone
concentrations (in µg/m3)
| threshold for: |
concentration |
averaging period |
| health protection vegetation protection
population information
population warning |
110
200
65
180
360 |
8 h
1 h
24 h
1 h
1 h |
A group of experts from the Members States have followed the practical implementation
of the Directive. Among other items this group discussed procedures for data reporting.
The formats for information and data exchanges have been defined in the document
"Council Directive 92/72/EEC on air pollution by ozone. Information and data
exchange/formats", Doc.Rev. 11/243/95. In general terms, the requested information
consists of two parts:
- information on stations and measurements techniques (Ozone Directive, article 4.2,
indents 1 and 2);
- information on ozone concentration: annual statistics and threshold exceedances (Ozone
Directive, article 6.1).
Based on the experiences in processing the data for the 1994 annual report, the
European Topic Centre on Air Quality (ETC-AQ) provided remarks concerning data
transmission and suggestions for improvement which were discussed in the Expert Group on
Photochemical Pollution. Considering the increasing amount of data requiring processing,
as well as the improvement of the transfer of data relating to the implementation of the
Directive, the Commission has prepared an update (April 1996) of the data exchange format.
The major changes concern the transfer of additional information:
- type of station: definition of the location of stations as recommended in the decision
on Exchanges of Information (97/101/EC);
- altitude of stations as recommended by the Expert Group;
- NOx and VOC data, according to Annex 2.3 of the ozone directive;
- file names: it is recommended to define unique names for all files in order to improve
the management and transfer of the data files.
For submission of the 1997 data no further modifications in data requirements and data
exchange formats have been made. Non-EU countries have been requested to submit their data
in agreement with these data exchange formats.
2.2 Data handling
According to the Ozone Directive the requested information over 1997
should have been forwarded to the Commission before 1 July 1998. All data forwarded by the
Commission and received at the European Topic Centre on Air Quality (ETC-AQ) before 12
August 1998 has been processed is this report. In this report the definition of the data
formats as described in the document Doc.Rev. 11/243/95 and its April 1996 amendment is
used as a reference. If necessary, files were converted at the ETC-AQ for further
processing.
Non-EU Member States were contacted via the European Environment Agency,
via the Phare Topic Link on Air Quality or, in case of Switzerland, directly and asked to
voluntary submit data following the standard formats on data exchange. Information has
been received from Switzerland, the Czech Republic, Latvia, Norway and Poland. At a
very late moment (18 September 1998) data from 8 stations in Slovakia has been received.
Although the data was delivered according to the agreed formats, the limited time and
resources did not allow to fully include the data in this report. Data from Slovakia are
included only in the overview tables 2-5 presented in Chapter 2 and 3.
The summary of received information presented in Table 2 shows that the
information for the EU is nearly complete. However, analysing the data revealed a number
of errors, ambiguities or missing data. It was attempted to contact national data
suppliers to clarify these points but generally this was not successful. Lack of e-mail
addresses or fax-numbers hampered a rapid dialogue.
Spain has not submitted statistical information and an incomplete set of
exceedances.
The data received from Italy was of a low quality. Typical errors
frequently found in the Italian information are:
- incomplete set of station information (co-ordinates, unique coding,
station type, etc. is missing);
- incomplete date of exceedance (month but not day or hour is given);
- inconsistent information on exceedances of the 180 µg/m3 and
200 µg/m3 threshold: for a number of stations, exceedances of the
200 µg/m3 threshold are not quoted as exceedance of the 180 µg/m3 threshold;
- there are clear indications that for a number of stations, in case of
exceedance of the daily threshold value of 65 µg/m3 the quoted maximum
concentration refers to an hourly averaged concentration in stead of the daily mean.
The data from France contain inconsistent information on exceedances of
the 180 µg/m3 and 200 µg/m3 threshold: for a number of
stations, exceedances of the 200 µg/m3 threshold are not quoted as exceedance
of the 180 µg/m3 threshold.
The statistical information of the Netherlands was in an incorrect
format; information on data coverage was not given. This precluded the further use of the
Dutch statistical information in the analysis.
A Measurement techniques file was not received for a number of
countries. Voluntary data on precursor concentrations has been received for nine Member
States and two additional countries.
For 1997 information on ozone concentrations (annual statistics and/or
exceedance information) has been received for 1076 monitoring stations of which 984
were located in EU-Member States. Figure 1 indicates that the number of reporting stations
is still growing. The large increase compared to 1996 is mainly due to the fact that over
1996 only 13 Member States submitted information.
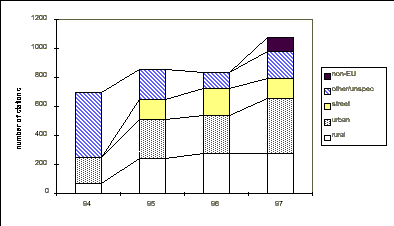
Figure 1. Number of stations reporting
ozone data within the framework of the ozone directive. Note that 1996 refers to the
actual reporting Member States. For stations in non-EU countries a station classification
is known but not resolved in this figure to maintain consistency with earlier years for EU
Member States.
Table 2. Summary of received information
over 1997.
| country |
station info |
meas.tech |
statistics |
exceedance |
NO2 |
NOx |
VOC |
| AT |
x |
x |
x |
x |
- |
- |
- |
| BE |
x |
- |
x |
x |
x |
- |
x |
| DE |
x |
- |
x |
x |
- |
- |
- |
| DK |
x |
x |
x |
x |
x |
x |
- |
| ES |
x(4) |
x(4) |
- |
x(3) |
- |
- |
- |
| FI |
x |
x |
x |
x |
x |
x |
- |
| FR |
x |
x |
x |
x |
- |
- |
- |
| GB |
x |
x |
x |
x |
x |
x |
- |
| GR |
x |
x |
x |
x |
x |
x(6) |
- |
| IE |
x |
x |
x |
x |
- |
- |
- |
| IT |
x |
x |
x |
x |
x |
x |
x |
| LU |
x |
x |
x |
x |
x |
x |
x |
| NL |
x |
- |
x(1) |
x(2) |
x(1) |
x(1) |
- |
| PT |
x |
x |
x |
x |
x |
x |
- |
| SE |
x |
x |
x |
x |
- |
- |
- |
| CH |
x |
x |
x |
x |
x |
x |
- |
| CZ |
x |
x |
x |
x |
x |
x |
x |
| LV |
- |
- |
x(5) |
x(5) |
- |
- |
- |
| NO |
x |
- |
x |
x |
- |
- |
- |
| PO |
x |
- |
x |
x |
- |
- |
- |
| SK |
x |
x |
x |
x |
- |
- |
- |
x: delivered;
-: not delivered;
(1) wrong format;
(2) originally data in wrong format; updated file received 18 August 1998;
(3) only period March-October; only exceedances of 180 µg/m3
(1h-averaged);
(4) no 1997-update received; information submitted for 1996 has been used;
(5) hourly data submitted for period April-December 1997; exceedances and statistics
calculated by ETC/AQ;
(6) Information on NO2 and NO (not NOx) has been
received.


Document Actions
Share with others