Air quality plans
The EU’s ambient air quality directives set air quality standards for certain pollutants in ambient air to protect human health and the environment. If these values are exceeded, Member States are required to take necessary action to reduce the concentrations of air pollutants and prepare an air quality plan that sets appropriate measures. The aim is to keep the exceedance period as short as possible.
Air quality plans are a principal tool used by authorities to improve air quality, reduce emissions of air pollutants and deliver benefits to public health. In the period 2014-2020, 21 Member States submitted at least one air quality plan to the EEA (ETC/ATNI 2021), including information on:
- short-term action plans and programmes to improve air quality
- measures planned in the context of air quality plans
- exceedances of EU air quality standards that triggered the development of short-term action plans and air quality plans, and the emission sources that contributed to those exceedances
- scenarios of how measures might improve air quality.
A total of 944 air quality plans were reported. Of these, 59% were reported to have been implemented, 15% to be in their first year of implementation and 17% to be under revision. This suggests that, while most plans were successfully implemented, a significant proportion needed further attention. The rest of the plans were in the preparation or adoption phase, or had been completed.
The majority of air quality plans aim to protect health, with most focusing on reducing levels of NO2 and coarse particulate matter (PM10). Only 5% of the exceedances reported were of other pollutants, including fine particulate matter (PM2.5) ozone (O3), nickel in PM10, lead in PM10, cadmium in PM10, Sulphur dioxide SO2 and benzene (in descending order). A small number of plans explicitly aim to protect vegetation, including three focused on reducing O3 and ammonia in Spain, four on O3 in France and two on nitrogen oxides (NOX) in Italy. Most exceedances (65%) were reported in urban areas, with 21% in suburban areas and the remainder in rural areas.
Sources of air pollutants driving exceedances
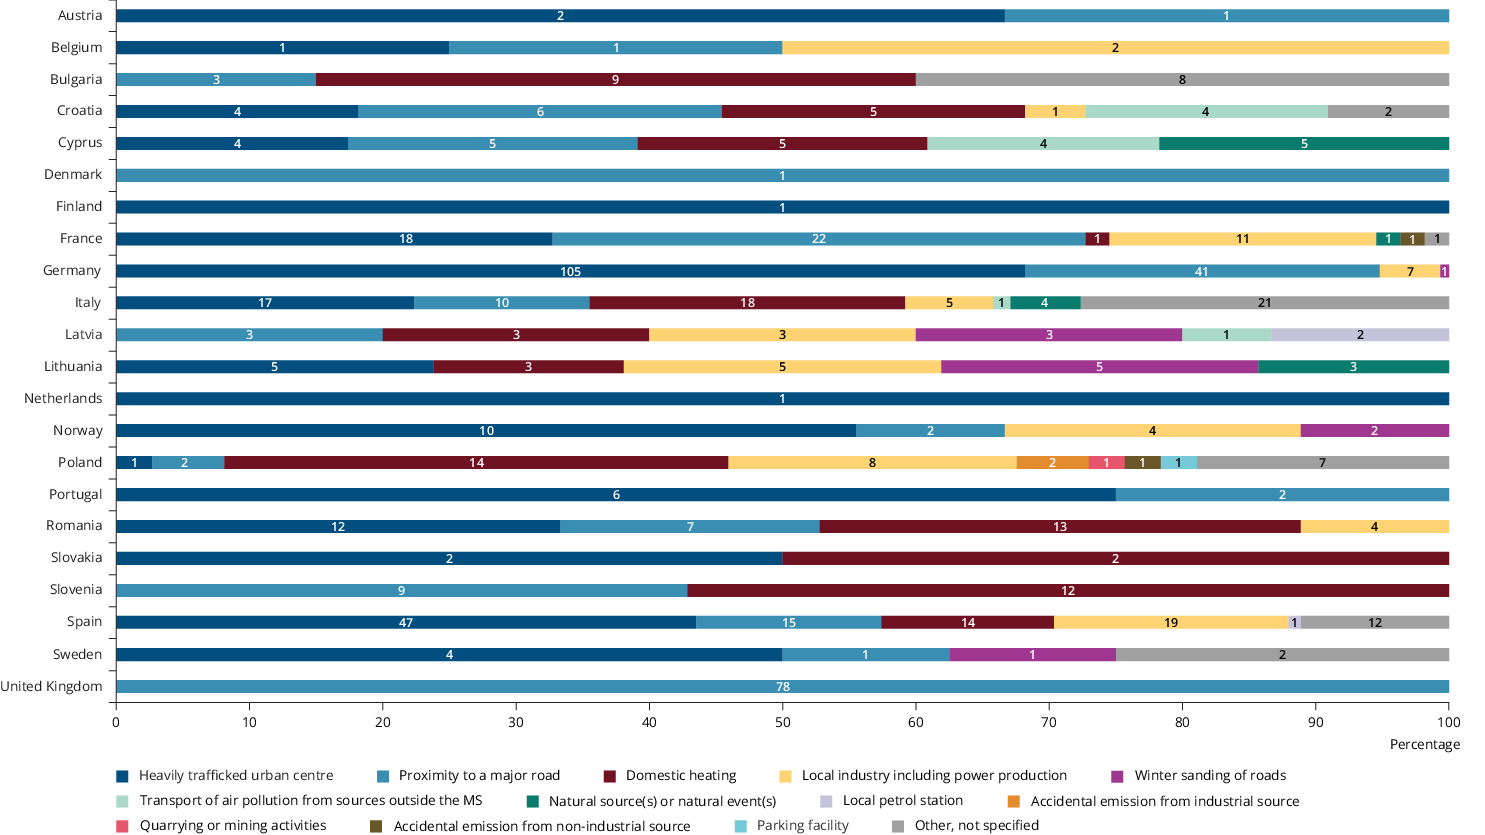
Member States report on the sources of the pollutants for which standards are exceeded. Figure 1 provides an overview of these emission sources.
Note: Data were not reported for Czechia, Estonia, Greece, Hungary, Iceland, Ireland, Liechtenstein, Luxembourg, Malta, Switzerland or Turkey.
More info...
Road traffic was the principal driver of the exceedances of NO2 reported. In fact, 64% of all reported exceedances were linked to dense traffic in urban centres and proximity to major roads. For six countries, namely Austria, Denmark, Finland, the Netherlands, Portugal and the United Kingdom, road traffic was the only major source of exceedances reported. In Germany and France, road traffic was behind 95% and 73% of all exceedances, respectively. In contrast, in other countries, road traffic was a less important source, behind only 8% of exceedances in Poland, 15% in Bulgaria and 20% in Lithuania.
Domestic heating was reported to be the second most important source driving exceedances of air quality standards across Europe, linked to 14% of total exceedances, and the principal driver of exceedances of coarse particular matter (PM10). Countries that reported domestic heating as a significant driver of exceedances include Slovenia, where 57% of exceedances were attributed to domestic heating, Slovakia (50%), Bulgaria (45%), Poland (38%) and Romania (36%).
Local industry was behind 10% of reported exceedances across Europe. At the national level, local industry drove 50% of exceedances in Belgium, 24% in Latvia, 22% in Poland and 20% in France.
Exceedances of ozone standards were reported by Italy, France and Spain, and were related to transport in urban and rural areas.
Measures to reduce emissions of air pollutants
As part of their air quality plans to reduce concentrations of key air pollutants, Member States put in place measures to reduce emissions. Such measures may be enacted under the air quality plans put in place under the Ambient Air Quality Directives. Alternatively, measures may be enacted as part of national air pollution control programmes, which Member States have to update at least every 4 years in the context of the National Emission Reduction Commitments Directive.
Across all the countries that reported putting in place measures through the air quality plans required by the ambient air quality directives:
- 70% of measures focused on the transport sector
- 12% focused on commercial and residential energy sectors linked to domestic heating
- 8% focused on industry
- 6% focused on shipping
- 4% focused on the agricultural sector.
Figure 2 summarises the number of measures put in place by source of emissions/sector and country.
Note: The number of measures put in place for each sector in each country are shown. These numbers are also expressed as percentages of the total number of measures put in place in each country. Data were not reported for Cyprus, Estonia, Greece, Hungary, Iceland, Ireland, Liechtenstein, Luxembourg, Malta, Switzerland or Turkey.
More info...
In terms of pollutants, 62% of measures focused on reducing emissions of NO2, while 26% focused on coarse (PM10) and 10% on fine (PM2.5) particulate matter. A small number of measures targeted benzo(α)pyrene (BaP).
The most common measures adopted to reduce concentrations of NO2, PM10, PM2.5 and BaP focused on traffic planning and management, representing 39% of all measures. Improving public transport was a common traffic management measure for reducing concentrations of all four pollutants. Other frequently reported measures include the management of parking spaces, speed limits, low-emission zones and modal shifts in transport.
Overall, 19% of measures focused on public information and education through different media channels. Fourteen per cent of measures focused on the use of low-emission fuels for small-, medium- and large-scale stationary sources and mobile sources.
Figure 3 presents aggregate information on the type and number of measures put in place to improve air quality across all reporting countries, categorised into:
- Traffic
- Awareness raising
- Public procurement
- Fuels
- Industry
- Other

Note: Data were not reported for Estonia, Greece, Hungary, Iceland, Ireland, Liechtenstein, Luxembourg, Malta, Switzerland or Turkey.
More info...
The level of the administrative authority responsible for putting measures in place varied: 86% were managed at the local level, 11% at the regional level and only 3% at the national level.
Air quality information and public awareness
Air pollution is recognised as the single largest environmental risk to public health, with most European citizens identifying the health impacts of air pollution as a very serious problem (European Commission, 2019). Public awareness and understanding of air pollution sources are important for gaining support for action to improve air quality. A lack of awareness of the health impacts of air pollution can create opposition to policies and measures to improve air quality.
Across Europe, authorities have met public opposition to some measures proposed to restrict road traffic or the domestic combustion of fuels for heating (ETC/ATNI, 2020). In other cases, citizens are actively involved in addressing air pollution, including through citizen science initiatives to monitor air quality and raise awareness (EEA, 2020).
As 76% of exceedances occur in urban and suburban areas, cities play a key role in successful air quality management. Air quality plans often include a focus on public information and education, to increase awareness and promote shifts away from activities associated with the emission of air pollutants.
Several cities are developing innovative approaches to improve communication about air quality, increase public awareness and engagement, and encourage changes in behaviour (EEA, 2018). The level of public acceptance of measures to improve air quality is higher in cities where citizens are better informed about air quality issues and the health benefits of clean air.
Please click on the examples below to view air quality measures from across Europe.
References
Directive 2008/50/EC of the European Parliament and of the Council of 21 May 2008 on ambient air quality and cleaner air for Europe
Directive 2004/107/EC of the European Parliament and of the Council of 15 December 2004 relating to arsenic, cadmium, mercury, nickel and polycyclic aromatic hydrocarbons in ambient air
Commission Directive (EU) 2015/1480 of 28 August 2015 amending several annexes to Directives 2004/107/EC and 2008/50/EC of the European Parliament and of the Council laying down the rules concerning reference methods, data validation and location of sampling points for the assessment of ambient air quality
2011/850/EU: Commission Implementing Decision of 12 December 2011 laying down rules for Directives 2004/107/EC and 2008/50/EC of the European Parliament and of the Council as regards the reciprocal exchange of information and reporting on ambient air quality
ETC/ATNI 2021, Report 9/2020: Air Quality Plans and Measures. Analysis of data submitted from 2014 to 2020
Directive (EU) 2016/2284 of the European Parliament and of the Council of 14 December 2016 on the reduction of national emissions of certain atmospheric pollutants, amending Directive 2003/35/EC and repealing Directive 2001/81/EC
EC 2019: Special Eurobarometer 497: Attitudes of Europeans towards Air Quality, version v1.00, European Commission, Directorate-General for Communication, 2019, accessed 2022-02-04,
ETC/ATNI 2020, Report 2/2020: Public awareness and efforts to improve air quality in Europe
EEA, 2020, Assessing air quality through citizen science, EEA Report No 19/2019, European Environment Agency.
EEA, 2018, Europe's urban air quality — re-assessing implementation challenges in cities EEA Report No 24/2018, European Environment Agency
Identifiers
Briefing no. 19/2021
Title: Managing air quality in Europe
EN HTML: TH-AM-21-019-EN-Q - ISBN: 978-92-9480-420-4 - ISSN: 2467-3196 - doi: 10.2800/17664
EN PDF: TH-AM-21-019-EN-N - ISBN: 978-92-9480-421-1 - ISSN: 2467-3196 - doi: 10.2800/851688


Document Actions
Share with others