2.1 Progress in reducing total greenhouse gas emissions in the European Union
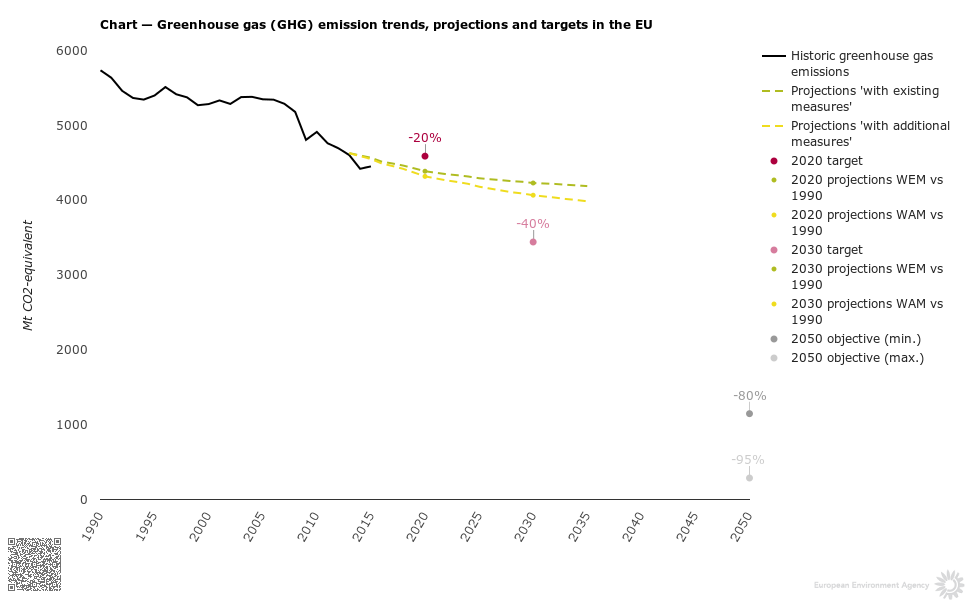
The European Union (EU) is well on track to achieve its greenhouse gas (GHG) emission reduction target of a 20 % decrease, compared with 1990 levels, by 2020. In 2014, the EU’s total GHG emissions were 23 % less than 1990 levels[1], and preliminary estimates suggest that emissions in 2015 were 4 451 Mt CO2-eq., which is 22 % less than 1990 levels. The 0.7 % increase observed in 2015 follows an exceptional 4.0 % reduction the previous year. Despite this small increase, 2015 levels remained below all historic levels observed between 1990 and 2013.
In 2014 and 2015, emission levels were also lower than anticipated by the latest projections available from Member States. According to these national projections, aggregated EU GHG emissions are expected to decrease until at least 2035 (see Figure 1.1).
- According to the scenario ‘with existing measures’ (WEM), which reflects the effects of all adopted and implemented measures at the time the projections were prepared, GHG emissions will be reduced by 23 % by 2020 and by 26 % by 2030 (compared with 1990 levels).
- According to the scenario ‘with additional measures’ (WAM), which also takes into account the measures that were at planning stage at the time the projections were prepared [2], GHG emissions will decrease by 25 % by 2020 and by 29 % by 2030 (compared with 1990 levels).
Although the 2020 reduction target is expected to be met by a sufficient margin, the policies and measures currently accounted for in national projections will not be sufficient to deliver the savings needed to achieve the EU’s reduction target of at least 40 % by 2030 (compared with 1990 levels). The pace of GHG emission reductions is actually projected to slow down after 2020, and achieving the mid- and long-term targets will require much faster reductions.
For this reason, a number of policy proposals developed by the European Commission are now being discussed among Member States and by the European Parliament. For example, these concern:
- a reform of the EU Emissions Trading System (EU ETS) to include a more stringent cap reduction after 2020 (EC, 2015);
- new annual binding GHG emission targets for Member States for the period from 2021 to 2030 (a new ‘effort sharing’ between Member States), specifically covering emissions that are not covered by the EU ETS, as well as new flexibilities to achieve these targets (EC, 2016a);
- the integration of the land use, land-use change and forestry (LULUCF) sector into the EU 2030 Climate and Energy Framework (EC, 2016b);
- a European strategy to cut emissions from the transport sector (EC, 2016c).
Further measures will be proposed in autumn 2016 to address energy efficiency and further develop renewable energy in the EU.
As GHG projections were, for the most part, reported by Member States in the first half of 2015, these proposals (or other policy developments at national level) are not reflected in the Member State projections [3].
Even if the 2030 target is achieved, a faster pace of emission reductions will be required if the EU is to reach its long-term (2050) decarbonisation objective — a reduction of EU GHG emissions by 80 to 95 % compared with 1990 levels. Such a reduction can take place only in the context of a major transformation of the EU’s socio-technical systems, such as the energy, food, mobility and urban systems. As the effects of policies and measures often take time to materialise (e.g. increases of energy efficiency in buildings), long-term action should not be delayed. Member States tend to prioritise low-cost mitigation measures, but they should also take into consideration the long-term mitigation potential of other measures, which are often postponed because of the high current costs or other difficulties related to their implementation. However, investments in these measures often make economic sense, even in the short term, as they significantly contribute to the generation of learning effects and thereby foster future cost reductions.
Click on the image for interactive data visualisation
Note: The GHG emission trends, projections and targets include emissions from international aviation, and exclude emissions and removals from the land-use sector. The ‘with existing measures’ (WEM) scenario reflects existing policies and measures, while the ‘with additional measures’ (WAM) takes into account the additional effects of planned measures reported by Member States. For the most part, these projections were reported in 2015 and therefore do not reflect the expected effects of recent policy proposals such as the reform of the EU ETS and other measures in non-ETS sectors for the period after 2020.
Source: EEA, 2016a, 2016b, 2016c and 2016d.
2.2 The European Union's policy framework for reducing greenhouse gas emissions
To achieve its future GHG emission targets, the EU has adopted sectoral targets and relevant legislation, for the following divisions:
- Emissions from large point sources, mostly from industrial installations, are covered by the EU ETS (EU, 2009a). These represent about 40–45 % of EU GHG emissions and a large proportion of them falls under the power generation sector. Other activities covered by the EU ETS include cement production, iron and steel production, and oil refining. Since 2012, the EU ETS covers GHG emissions from aviation (EU, 2008). The mitigation of all ETS emissions is being addressed at EU level through a single ETS-wide emission cap [4] and a ‘carbon market’ through which emission allowances can be traded.
- GHG emissions not covered by the EU ETS are covered under the Effort Sharing Decision (ESD) (EU, 2009b). These emissions are from a more diverse range of sectors or activities, including road transport, energy consumption in buildings, agriculture (cattle and soils) and waste management. Since 2013, The ESD sets annual targets for each Member State from 2013 until 2020. Mitigation actions therefore take place at national level, through a combination of EU-driven policies and measures, and national initiatives.
- GHG emissions and removals from the LULUCF sector are not covered under either the EU ETS or the ESD. LULUCF activities represent a net reported carbon sink, removing the equivalent of about 7 % of the EU’s total GHG emissions every year. These removals are not taken into account in the EU’s 2020 target under the 2009 climate and energy package. However, in 2016, the European Commission proposed to integrate this sector into the EU 2030 Climate and Energy Framework from 2021 onwards [5].
Formally speaking, Member States are therefore responsible for reducing or limiting emissions covered under only the ESD, while ETS emissions are tackled at EU level.
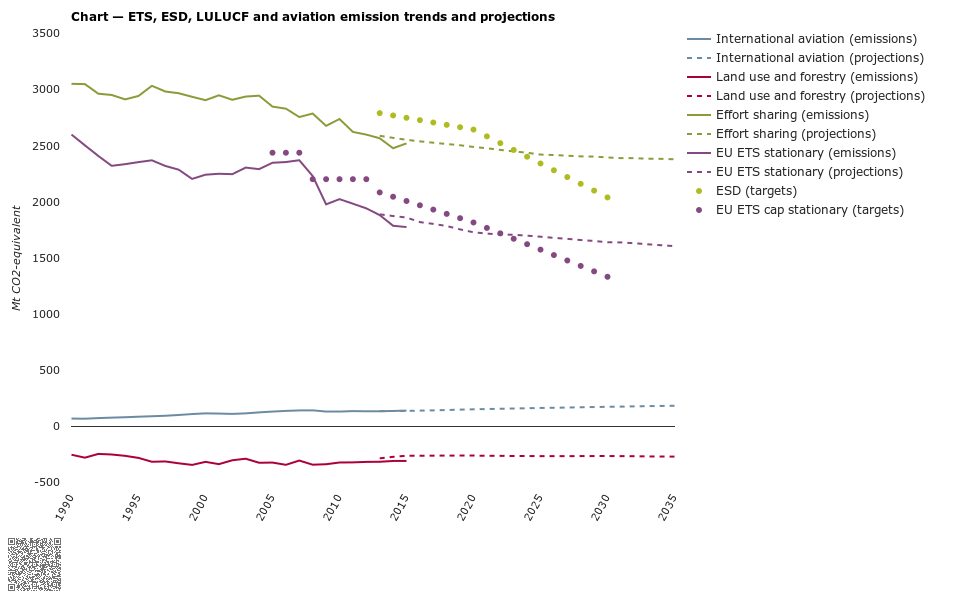
GHG emissions in EU ETS sectors and in ESD sectors have been following different trends since 1990 [6]. The projections reported by Member States also show significant differences between these two categories (see Figure 1.2). These trends are described and analysed in the following sections.
Click on the image for interactive data visualisation
Note: (a) Net removals from land use, land-use change and forestry (LULUCF) correspond to reported values, which differ from values accounted towards targets.
(b) The targets for the period from 2021 to 2030 are based on proposed legislation.
The projected values, starting from 2013, are presented for the ‘with existing measures’ (WEM) scenario, which reflects existing policies and measures. These projections from Member States were reported, for the most part, in 2015 and therefore do not reflect the expected effects of recent policy proposals such as the reform of the EU ETS and other measures in non-ETS sectors for the period after 2020.
Source: EC, 2013a, 2013b, 2015 and 2016a; EEA, 2016a, 2016b, 2016c, 2016d and 2016e; EU, 2009a.
2.3 Emission trends under the European Union Emissions Trading System
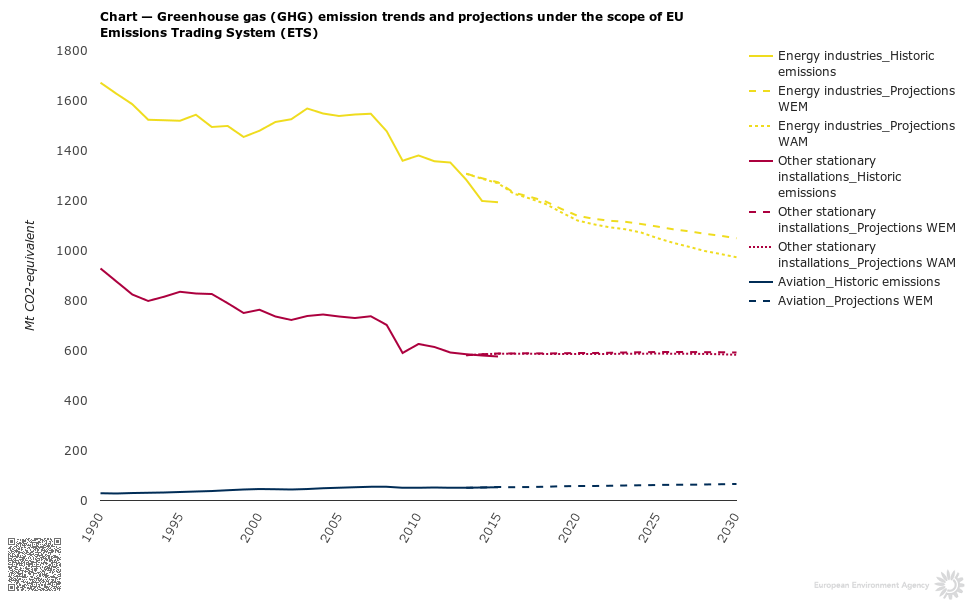
GHG emissions from the sectors covered by the EU ETS have decreased significantly since 1990 (see Figure 1.3). The EU ETS target was defined in order to reduce emissions by 21 % between 2005 and 2020. In 2015, EU ETS emissions from Member States’ stationary installations had already decreased by 24 % since 2005, and reached their lowest level since the start of the scheme in 2005 [7]. The decrease since 2005 was mostly driven by reductions in emissions related to power generation. The reduction in emissions was largely the result of changes in the combination of fuels used to produce heat and electricity, in particular a decrease in the use of hard coal and lignite fuels, and a substantial increase in electricity generation from renewables, which almost doubled over the period. Emissions from the other industrial activities covered by the EU ETS have also decreased since 2005, but remained stable in the current trading period (2013–2015) (EEA, 2016f).
According to the projections submitted by Member States in 2015 and 2016, future cuts in national GHG emissions will take place mainly under the EU ETS. With the existing measures in place, emissions from stationary installations under the EU ETS are projected to decrease by 7 % between 2015 and 2020, and by 5 % between 2020 and 2030. According to scenarios that consider additional measures, reductions of an additional four percentage points are projected for 2020 and 2030, compared with the reductions predicted by the scenario with existing measures. Most of the projected reductions by 2020 and 2030 are expected to occur in the energy industries sector, while emissions from other activities are envisaged to remain relatively stable during this period. However, emissions from international aviation nearly doubled between 1990 and 2014 and are expected to increase further by 2030.
Click on the image for interactive data visualisation
Note: Solid lines represent historic GHG emissions (available for the 1990–2015 period). Dashed lines represent projections of the WEM scenario. Dotted lines represent projections under the WAM scenario.
The EU ETS GHG emissions presented were estimated based on the attribution of GHG emissions, reported by source categories in national GHG inventories and national projections, to EU ETS sectors and/or non-ETS sectors.
Source: EEA, 2016a, 2016b, 2016c and 2016d.
2.4 Emission trends under the Effort Sharing
GHG emissions from sectors covered by the ESD have decreased since 1990, albeit at a slower rate than those covered under the EU ETS. This reflects the diversity (and mitigation potentials) of the sectors covered by the ESD. In 2014, ESD emissions were 13 % below 2005 levels. Preliminary estimates indicate that, in 2015, ESD emissions increased back to a level that is 11 % less than the 2005 level. However, this still represents a reduction that is greater than the 9 % reduction objective for ESD emissions between 2005 and 2020 at EU level.
According to national projections based on the WEM scenario, ESD emissions could be 155 Mt CO2-eq. below the ESD target for 2020, and cumulated ESD emissions in the EU for the whole 2013–2020 period could be lower than the overall emission budget for all Member States under the ESD by about 1 600 Mt CO2-eq. In addition, if planned ‘additional measures’ are taken into account, this cumulated surplus could increase to over 1 700 Mt CO2-eq. However, certain Member States experience more difficulties than others in achieving their ESD targets (see Chapter 2).
For 2030, Member States project a 16 % reduction of ESD emissions compared to 2005 in the WEM scenario, and a 19 % reduction in the WAM scenario. These reductions remain insufficient compared with the 30 % reduction that non-ETS sectors should achieve by 2030, as a contribution to delivering the EU target of an at least 40% domestic reduction in greenhouse gas emissions by 2030 compared to 1990 (see Figure 1.2).
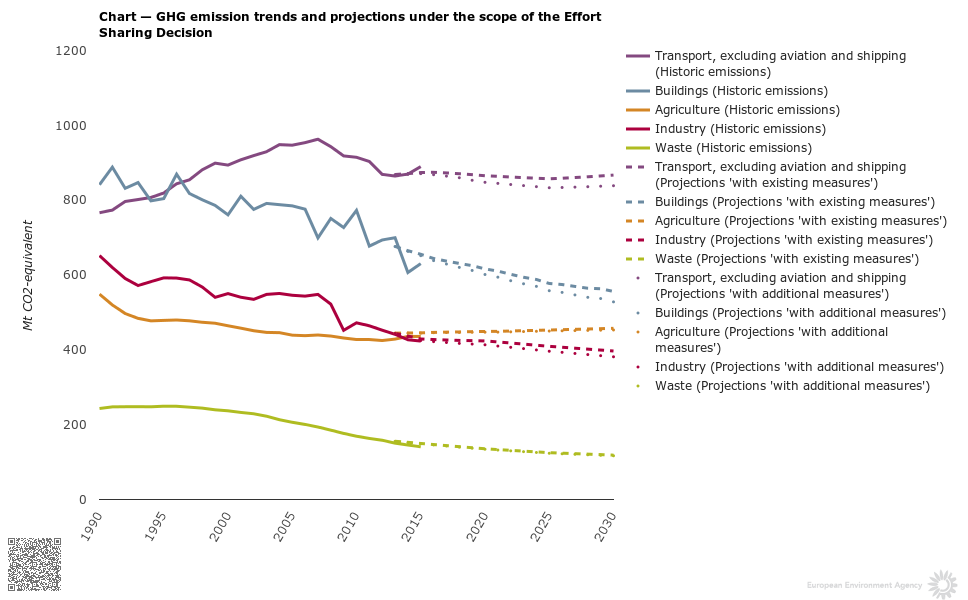
Since 1990, the building sectors have contributed most to absolute emission reductions in the sectors covered by the ESD. However, emissions from the transport sector, which is the largest contributor to GHG emissions under the ESD, increased continuously between 1990 and 2007. After a decrease between 2007 and 2013, emissions from this sector increased again in 2014 and 2015.
Member States have projected only limited decreases in ESD emissions between 2015 and 2030, particularly for after 2020. The largest decreases are expected to take place in the building sector. In the transport sector, emissions are projected to remain relatively stable, while agriculture emissions are anticipated to increase. Implementing the additional measures (i.e. at planning stage up to early 2015) would lead to minor further emission decreases, especially in the building and transport sectors (see Figure 1.4).
Click on the image for interactive data visualisation
Note: Solid lines represent historic GHG emissions (available for the 1990–2014 period). Dashed lines represent projections in the ‘with existing measures’ (WEM) scenario. Dotted lines represent projections under the ‘with additional measures’ (WAM) scenario.
The non-ETS emissions presented are estimated based on the attribution of GHG emissions, reported by source categories in national GHG inventories and national projections, to EU ETS sectors and/or non-ETS sectors.
Source: EEA, 2016a, 2016b, 2016c and 2016d.
2.5 Emissions from land use, land-use change and forestry
Land use and forestry activities, which include the use of soils, trees, plants, biomass and timber, can result in both emissions and removals of CO2. In 2014, the LULUCF sector represented a net carbon sink of about 308 Mt CO2-eq. in the whole of the EU. The sector constituted a net reported sink for all EU Member States except Denmark, Ireland, Latvia and the Netherlands. The EU sink was dominated by CO2 absorbed from existing and new forests. Over the past decade, the relatively large proportion of young forests and moderate harvest rates have led to a net carbon accumulation in European forests.
While being a net sink, the sector was also the source of CO2 emissions. The largest source was land conversion, especially from forests to other land uses (also known as deforestation), and emissions from organic soils converted to cropland use. Since 2000, the net reported annual LULUCF sink has been on average 320 Mt CO2-eq., with a decreasing trend over the last 7 years. According to the EU Reference Scenario 2016 (EC, 2016d), the net reported LULUCF sink in the EU is expected to continue decreasing, by about 10 % between 2010 and 2020, despite a decrease in emissions from cropland and grassland (due to reduced rates of land conversion to cropland, and lower emissions expected from agricultural soils). The current EU forest sink could also potentially be affected by the increased use of bioenergy.
In order to address this overall projected decrease, in July 2016, the Commission proposed a binding commitment for each Member State covering GHG from forestry and agriculture, and an upgrade of accounting rules to determine compliance. These changes are expected to improve the identification of additional mitigation action, and to thereby enhance the environmental integrity of the sector. Stronger incentives for action are also provided by enabling trade between Member States within the LULUCF sector, and creating a limited flexibility for the use of certain, robust LULUCF credits with other non-ETS sectors.
The proposal requires, as a principal commitment, each Member State to ensure that accounted GHG emissions from land use are entirely compensated by an equivalent removal of CO2 from the atmosphere in non-ETS sectors (the ‘no debit rule’). In essence, if a Member State converts forests to other land uses (deforestation) or increases emissions from croplands, it must compensate for the resulting emissions by planting new forests (afforestation), by improving the sustainable management of existing forests, croplands and grasslands, by using allocations from the other non-ETS sectors, or by agreeing to trade emission credits with other Member States. Although Member States undertook this commitment under the Kyoto Protocol up to 2020, the proposal enshrines the commitment in EU law for the 2021–2030 period.

Document Actions
Share with others