General recommendations on how to view the dashboards
Settings (e.g. language), browser, size and resolution of each computer affect the view of the dashboards (functionality of the dashboards may differ e.g. tooltips may not be visible similarly in all browsers, view of dots or commas may differ, fitting of dashboards within the screen may need adjustment). It may be advisable to zoom your screen at views lower than 100% in order to have a full vision of some dashboards. ‘Scrollable’ bars may become activated within the dashboard if the view does not fit the screen. Use the bars or the arrows of the keyboard to move the dashboard view.
How to download data and graphs
The data and graphs included in the dashboards can be downloaded from the functionality ‘Download’ at the right bottom corner of the dashboards.
Clicking the button ‘Download’ will lead you to multiple downloading options.
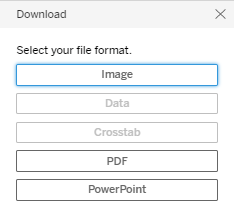
By default, only ‘Image’, ‘PDF’ and ‘PowerPoint’ are activated and will allow the download of the dashboard image. In PDF or Power Point format you can select to download all or specific sheets of a specific workbook or dashboard.
To download data please select the table/bar chart of interest, this will activate the data download options ‘Data’ and ‘Crosstabs’.
The ‘Data’ option will allow access to the summary dataset behind the table or bar chart. This is downloaded automatically as a text file.
The option ‘Crosstab’ downloads the selected table as presented in the dashboard in Excel format.
If the ‘Data’ and ‘Crosstab’ options are greyed out/not available, please click in the dashboard to highlight some area of the table/bar graph, then un-click by pressing again the same area and return to ‘Download’ button.
To note:
- only data selected in the filters will be downloaded (see ‘How to filter values’ below).
- the column headings in downloaded data may differ to those shown on the dashboard as aliases are occasionally used for display
How to filter values
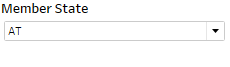
Dashboards may have variable filtering options. Please press the little arrow at the right of each selection field to see the filtering options and select accordingly.
To note:
- Please note that when filtering for Member State, the only dashboard that does not separate the Member State from its sub-national region is ‘General information on the Natura 2000 network’. The remaining dashboards separate these e.g. PT, PMAC, PTAC.
How to select values
Values are selected (single cells, entire rows of tables, parts of bar charts) by clicking on the feature in the bar chart or table. Alternatively, some dashboards may have a ‘highlight’ function in the filter section. This can be used to highlight specific values directly in the tables.
To deselect a value just click in the same place a second time (this is also applied to clicking/highlighting anywhere in the dashboard).
How to sort tables
Data in tables within a dashboard can be sorted horizontally or vertically. Click on the column or row header to see the sorting possibilities.

If the procedure of deselection or canceling of your choice described above does not function, please refresh your screen.
General remarks on the methodology
Detailed specific notes on methodology for each dashboard can be seen by hovering over or clicking the symbol below.

To freeze the methodology window and allow the information within to be copied it is necessary to double click on the symbol above. The tool tip window is frozen when the extra tool bar appears on the pop-up (see below – ‘Keep only – Exclude’). There is no need to click on this extra tool bar.

The dashboards are part of the National Summaries presenting the main results of the Member States Article 12 reporting. The Member States national summaries in printable format and a detailed description on the information from the reporting format used in the dashboards can be found in the Template of Art 17 National Summaries https://circabc.europa.eu/ui/group/173a90fc-40bf-492d-a3a9-df99c4aa8807/library/1480caf0-b524-447a-9bd9-3d8ebed736dd?p=1&n=10&sort=modified_DESC
The statistics are based on the data reported and checked by the Member States, before being ‘harmonised’ by ETC/BD or crosschecked with the latest Natura 2000 database (for Natura 2000 sites). The data reported by Member States are stored in the Central Data Repository (CDR) https://cdr.eionet.europa.eu/ . To access the data in CDR click on the Member State you are interested in and then ‘European Union (EU) obligations’, ‘Birds Directive: Report on implementation measures’. Additionally, a link is available at the bottom of each dashboard leading to the more recent deliveries in relation to Article 12 reporting. A ‘harmonised’ database with Member State data and EU assessments will be available at EEA’s website from October 2020.
A mix of taxonomic levels (species, sub-species and population levels) was used for the Article 12 reporting from the Member States. The word ‘taxa’ used in the National Summaries refers to a mixture of levels used in the Member States reporting and in these summaries.
The statistics for 2013-2018 reporting period include information for taxa present regularly, and if available for newly arriving species and for extinct species since 1980 or before 1980 if there is a reintroduction project (for further details see general methods for national summaries https://circabc.europa.eu/ui/group/173a90fc-40bf-492d-a3a9-df99c4aa8807/library/b619e4b1-aff1-4a20-990e-41bf7174f6c4/details?download=true).
The bird taxa included in the statistics are flagged as 'Use for statistics = yes’ in the Table for reported habitats and species of each Member State (see workbook for breeding population and distribution trends).
The statistics for the 2007-2012 reporting period include bird taxa present in the statistics of the 2015 State of Nature report (which, with the exception of some cases, are based on the same criteria as the statistics in the 2013-2018 period). Blank cells in the Tables mean that the Member States have left the specific fields blank in the reporting format.
The figures for Natura 2000 are as reported by Member States in their national reports. These figures have not been crosschecked with the latest Natura 2000 database. For information from the official Natura 2000 dataflow please look here: https://www.eea.europa.eu/data-and-maps/dashboards/natura-2000-barometer.

Document Actions
Share with others