All official European Union website addresses are in the europa.eu domain.
Chart (static)Published 29 Jan 2014Modified 20 Sept 2024
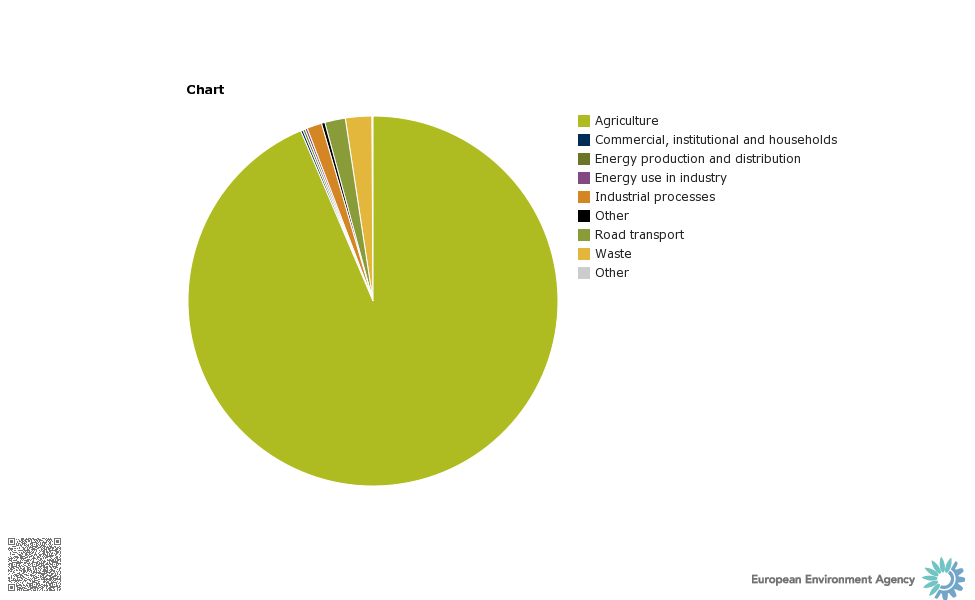
Note: The contribution made by different sectors to emissions of ammonia in 2011.