All official European Union website addresses are in the europa.eu domain.
See all EU institutions and bodiesAn official website of the European Union | How do you know?
Environmental information systems
EN
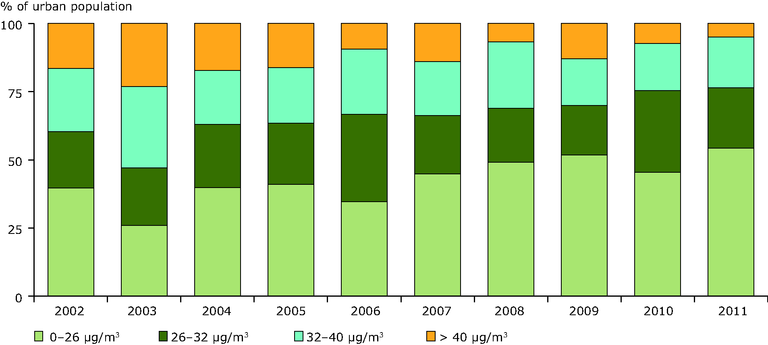
The NO2 monitoring data in AirBase provide the
basis for estimating the exposure of the European
population to exceedances of the NO2 annual mean
limit value of 40 µg/m3. Figure 4.4 presents this data
for the period 2002–2011, based on NO2 measured
at urban background monitoring stations.
Loading