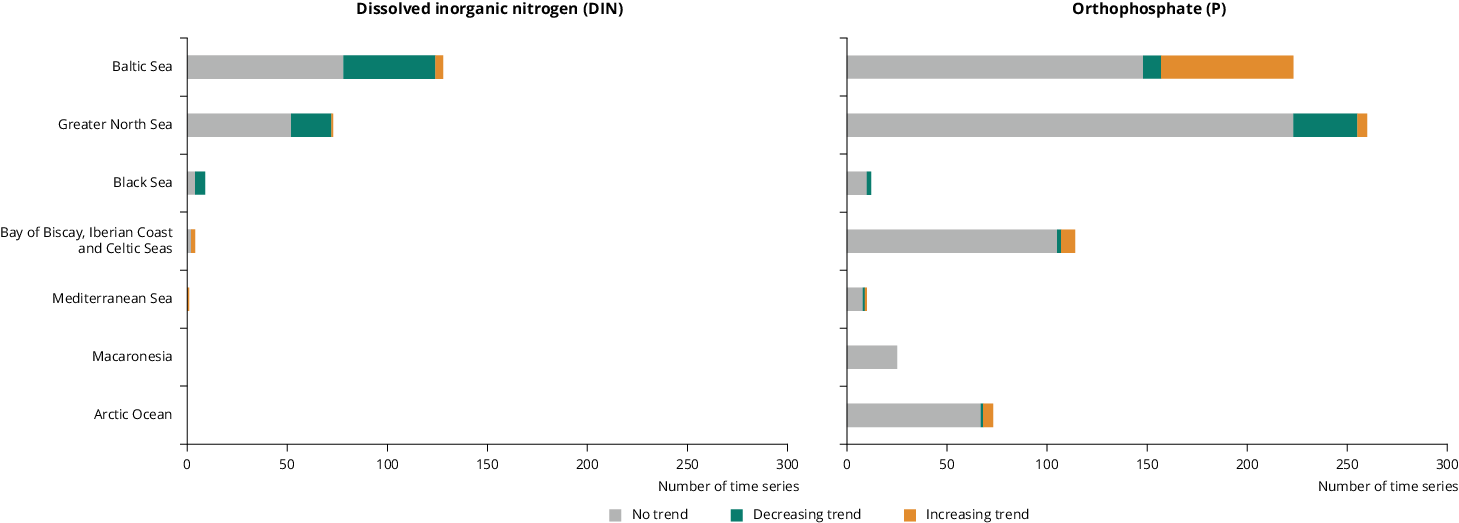
- Trends in concentrations of the nutrients, nitrogen (dissolved inorganic nitrogen — DIN) and phosphorus (orthophosphate), in the upper 10m of the water column in European seas during the season of low phytoplankton growth (SLPG) are shown for the period 1980-2019.
- Green bars indicate stations with significant (p<0.05) decreasing trends; orange bars show stations with significant (p<0.05) increasing trends; and grey bars show stations with no significant trends.
- The temporal range specified is the maximum range of dates for raw observations but this range varies upon the availability of observations at each location.
- DIN refers to the sum of ammonium, nitrite and nitrate concentrations, although in many samples not all three forms of nitrogen were measured.
- Data were aggregated into squares with sides of 0.01 degree for coastal stations (within 20 km from the coastline) and 0.05 degree for open water stations.
- SLPG was considered August-October in the Mediterranean Sea and Black Sea, January-March in the Baltic Sea and January-February in the other regional seas.
- Temporal trends were estimated with the non-parametric Mann-Kendall test. Only stations having data of at least 5 years and having at least data in the last 5-year period (2015-2019) were considered. A p-value<0.05 was used to consider a statistically significant trend.


Document Actions
Share with others