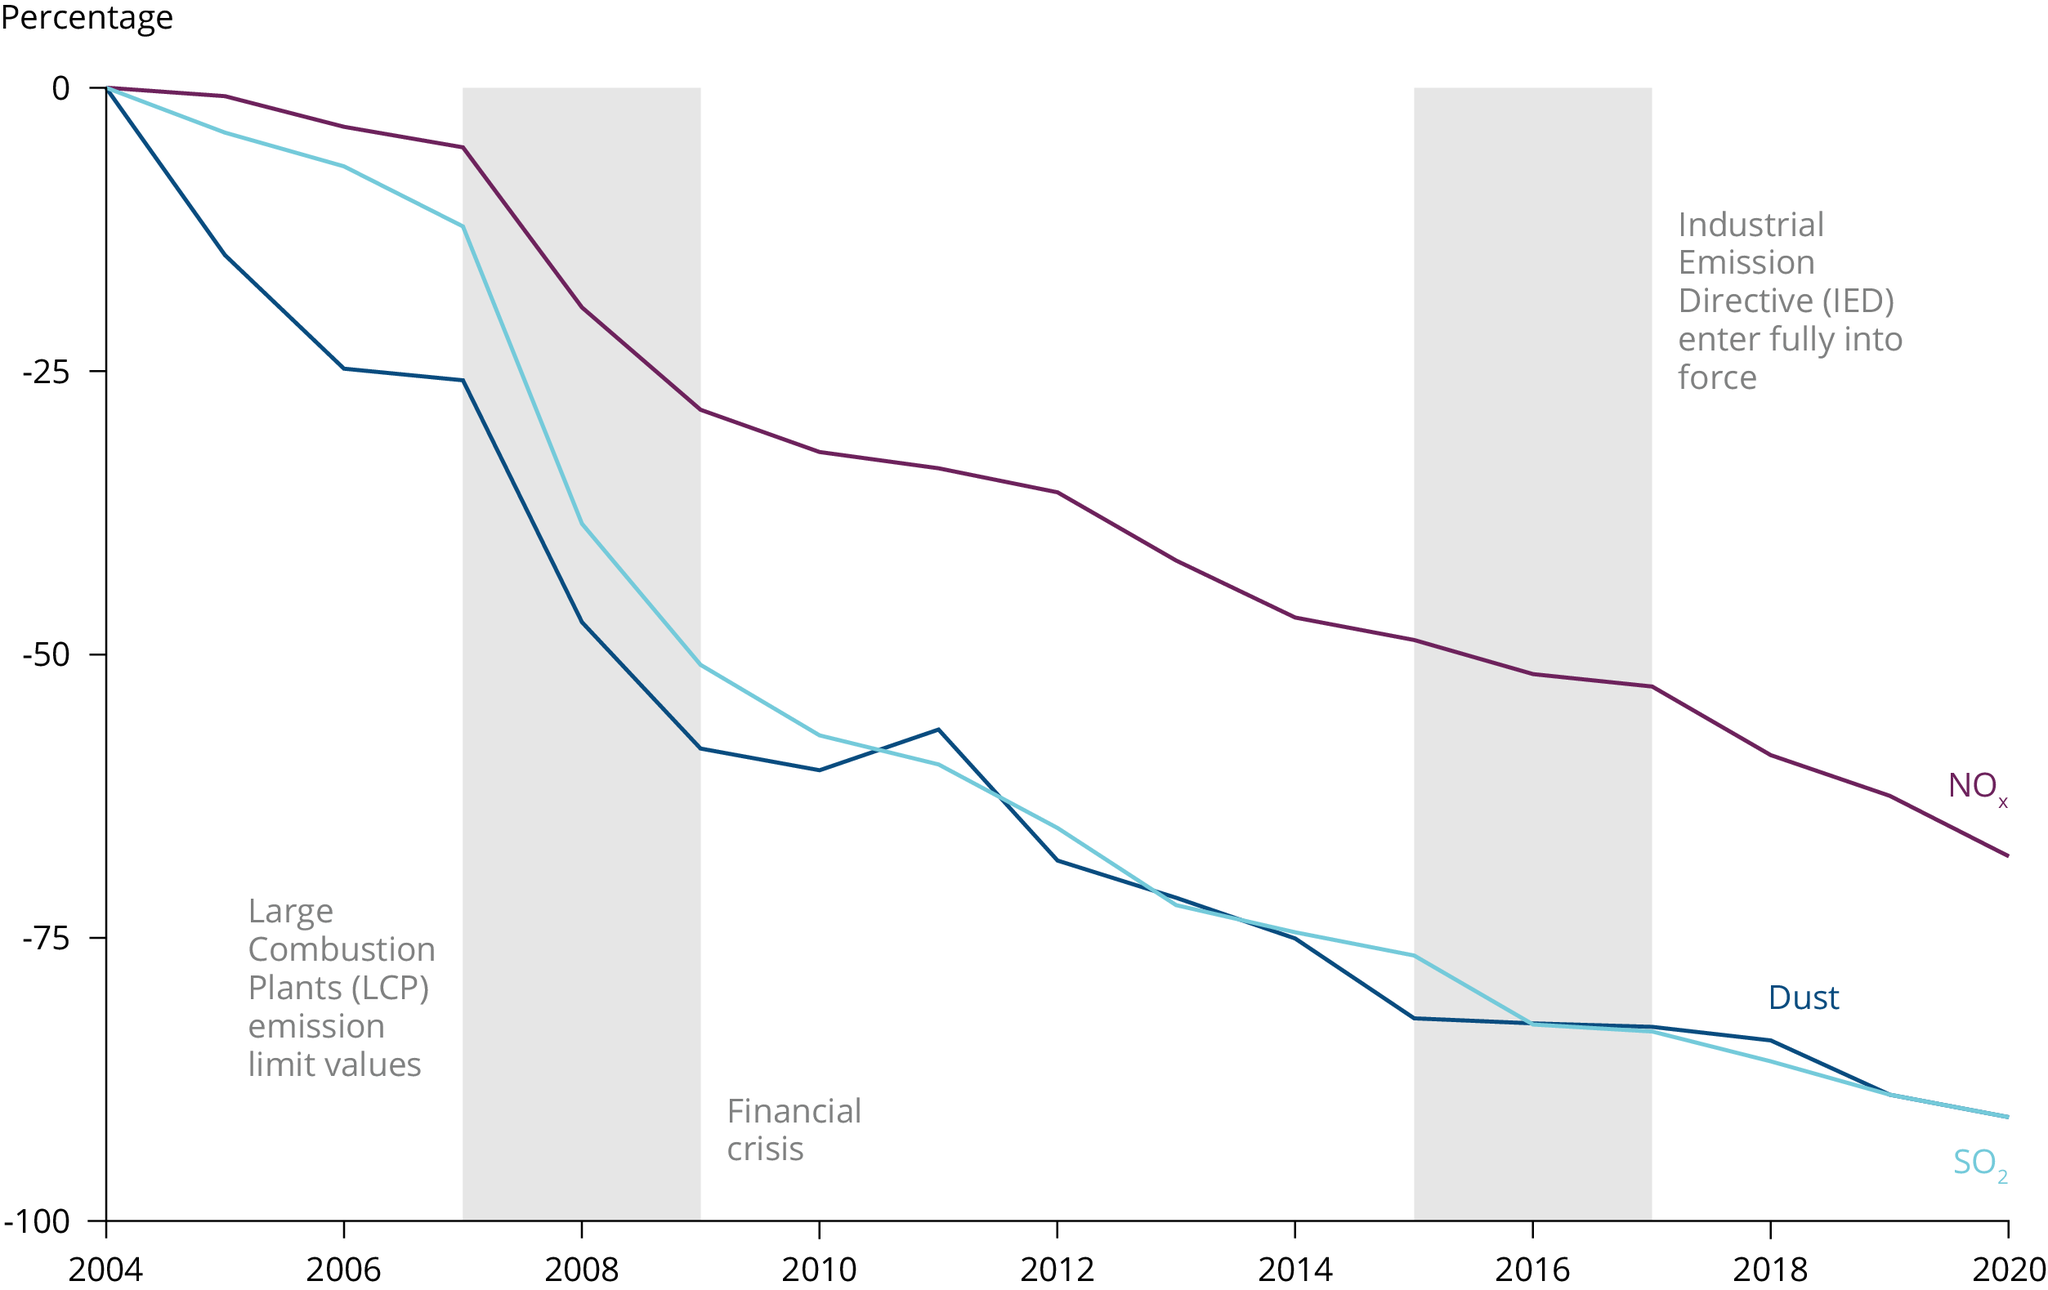
Data on large combustion plants covered by the Large Combustion Plants Directive (until 2015) and the Industrial Emissions Directive (as from 2016). Data from Croatia only available as from 2009, while its influence in the overall EU-27 numbers is negligible. Data as from 2016 include a small number of additional plants due to changes in the scope of the reporting, so the emissions from before and after 2016 are not fully comparable. Data were processed to remove outliers and gap-fill missing data in certain instances.
- Germany and Lithuania: data for 2017 used for 2018-2020 due to lack in reporting.
- Italy and Malta: data for 2019 used for 2020 due to lack in reporting.
- Slovakia: data for 2015 used for 2016-2020 due to lack in reporting in the new system.
- Spain: correction of 2019 NOx due to comma separator mistake in one LCP (verified with country).


Document Actions
Share with others