Figure
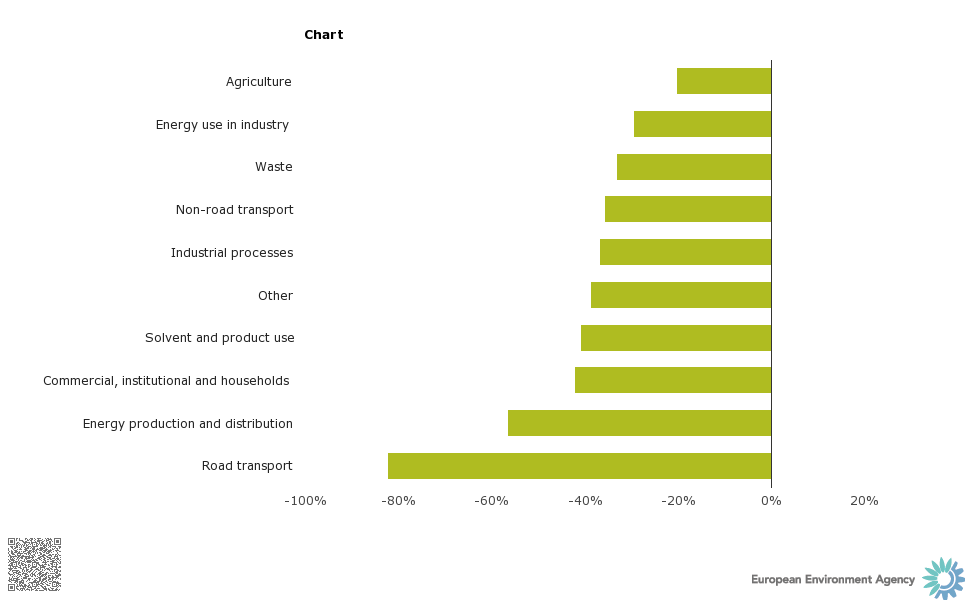
Change in non-methane volatile organic compound emissions for each sector between 1990 and 2008 (EEA member countries)
Go to latest version
Permalinks
- Permalink to this version
- 01af7bd15732d8f7e511cc2bf44141c8
- Permalink to latest version
- MAP0FNPR6M
Older versions
Geographic coverage
Temporal coverage
For references, please go to https://www.eea.europa.eu/data-and-maps/figures/change-in-non-methane-volatile-organic-compounds-emissions-for-each-sector-between-1990-and-2007-eea-member-countries-2 or scan the QR code.
PDF generated on 03 Feb 2023, 09:16 AM
Document Actions
Share with others