3. SUMMARY OF REPORTED DATA FOR 1996
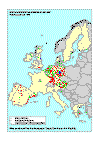
The location of monitoring stations which are used for the
implementation of the ozone directive and which were included in reporting for 1996 is
presented in Map 1. In total, information for 836 stations in 13 Member States was
received. All reporting Member States use the reference method (UV absorption) as
prescribed in Annex V of the Ozone Directive. However, at a limited number of stations the
chemiluminescence method is used.
Exceedance of the threshold value of 360 µg/m3 for hourly
values was observed on 21 May at two stations in Greece and at two Italian stations2, see Table 2.
Table 2. Observed exceedances of the threshold value of 360 µg/m3
for hourly average concentrations, period 1 January - 31 December 1996.
| country |
station name & city |
date, time |
max. conc. (µg/m3) |
| Greece |
Liosia, Athens Marousi |
21 May 1996, 14.00 21 May 1996, 13.00 |
391 361 |
| Italy |
Boccadifa, Palermo Cuile Bo, Porto Torres |
14 November 1996, 0.00 16 December 1996, 17.00 |
368 371 |
The high ozone levels in Greece are not associated with a widespread episode over
Europe but they have a rather local character; for other Member States exceedance of the
180 µg/m3 threshold value was not reported on 21 or 22 May. The exceedances in
Italy were observed in the winter months when such high levels are unexpected. On 14
November no other Italian station showed ozone levels exceeding 180 µg/m3; on
16 December only one station in Naples (400-500 km from Porto Torres) showed an exceedance
of the 200 µg/m3 threshold value (the maximum observed hourly concentration
during that day was 206 µg/m3). Investigations of these high concentrations
are continuing with the national experts; An explanation of these exceptionally high
levels cannot be given here.
A summary of the maximum concentration measured at any of the reporting stations where
exceedance3 of a threshold value is observed is presented for
each Member State in Table 3. When no exceedances of a threshold have been reported by a
country this is indicated with a dash (-).
As the number of monitoring stations differs widely from country to country, the
absolute number of exceedances is less suitable for comparison. Therefore, the concept of
"occurrence of exceedances" introduced in earlier reports is presented here.
Occurrence of exceedances is defined as the average number of observed exceedances per
country, that is, the total number of exceedances summed over all the stations of a
country divided by the total number of reporting stations. A summary of occurrence of
exceedances is presented in Table 4. There are two additional reasons which hamper a
comparison between the Member States. Firstly, the local environment (in particular NOx
sources) influences the ozone levels; the differences between countries partly result from
the differences in the ratios of street, urban and rural stations.

Map 1. Location of ozone monitoring stations as reported by Member States in the framework
of the Ozone Directive for the reference period 1996.
Table 3. Maximum ozone concentrations (in µg/m3) measured during a
period of exceedance of threshold values (reference period 1 January - 31 December 1996).
A dash (-) indicates that no exceedances have been observed. For two member states no data
is available (na).
| |
180
(1h) |
200
(1h) |
360
(1h) |
110
(8h-a) |
110
(8h-b) |
65
(24h) |
AT |
224 |
224 |
- |
201 |
210 |
185 |
BE |
243 |
243 |
- |
205 |
217 |
141 |
DE |
269 |
269 |
- |
198 |
222 |
183 |
DK |
200 |
200 |
- |
154 |
177 |
125 |
ES |
335 |
335 |
- |
258 |
232 |
210 |
FI |
190 |
- |
- |
161 |
158 |
146 |
FR |
na |
na |
na |
na |
na |
na |
GB |
242 |
242 |
- |
197 |
227 |
182 |
GR |
391 |
391 |
391 |
228 |
246 |
142 |
IE |
- |
- |
- |
137 |
150 |
128 |
IT |
371 |
371 |
371 |
237 |
232 |
166 |
LU |
199 |
- |
- |
177 |
174 |
152 |
NL |
265 |
265 |
- |
191 |
234 |
130 |
PT |
275 |
275 |
- |
151 |
186(c) |
147 |
SE |
210 |
210 |
- |
182 |
185 |
166 |
EU-15(d)
|
391 |
391 |
391 |
258 |
246 |
210 |
(a) based on three non-overlapping eight hourly values between
0.00-8.00; 8.00-16.00; 16.00-24.00;
(b) based on the eight hourly value between 12.00 - 20.00;
(c) this value contradicts the maximum value reported for the moving 8-h
average concentration (169 µg/m3, see Table 6);
(d) France not included.
Secondly, in four member states 20-50% of the reporting stations show a
data coverage of less than 75%; this might result in an underestimation of the number of
exceedances. Full details on the number of exceedances at the individual stations is
presented in Table I.1 of Annex I.
The longest period of consecutive days on which thresholds were exceeded
and the average length of an exceedance period are presented in Tables I.2 and I.3 of
Annex I. Table 5 summarises the number of days on which at least one exceedance has been
observed in a Member State. It is clear that the threshold value for protection of
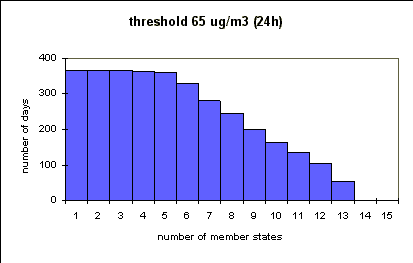
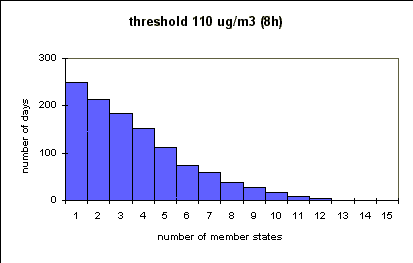
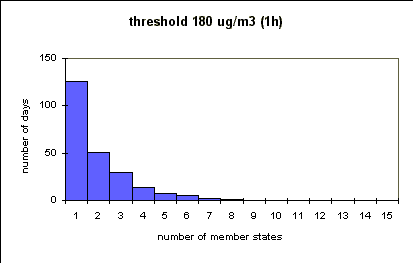
vegetation is exceeded almost every day. Histograms based on a daily count of the number
of Member States with at least one exceedance are presented in Figure 2; note that a
systematic underestimation of the number of days will be found due to data missing from
two Member States.
For each of the Member States, the lowest and highest 50-, 98- and
99.9-percentile values observed at individual stations with a data-coverage of 75% or
more, are presented in Table 6. In this table information on the maximum values is also
included. Note that the maximum 8-hourly concentration, as reported in Table 6, is based
on a moving average and may therefore differ from the values in Table 3 which are based on
fixed 8-hourly periods. Detailed information on the percentile values and maximum
concentrations observed at individual monitoring stations is given in Annex I, Table I.4.
Table 4. Occurrence of exceedances (reference period 1 January - 31
December 1996);
n.a. = no information available.
| |
|
threshold
value (in µg/m3) |
| |
number of
stations (c) |
180
1h |
200
1h |
110
8h(a) |
110
8h(b) |
65
24h |
AT |
111 |
0.8 |
0.1 |
30.2 |
34.9 |
108.5 |
BE |
23 |
1.6 |
0.5 |
16.7 |
17.2 |
38.3 |
DE |
369 |
1.7 |
0.5 |
15.6 |
23.7 |
56.2 |
DK |
6 |
0.2 |
0.2 |
7.7 |
12.2 |
88.0 |
ES |
189 |
1.1 |
0.4 |
17.0 |
22.6 |
71.8 |
FI |
10 |
0.2 |
0.0 |
15.3 |
17.4 |
129.9 |
FR |
na |
na |
na |
na |
na |
na |
GB |
50 |
1.1 |
0.3 |
6.1 |
8.2 |
34.9 |
GR |
15 |
10.6 |
7.5 |
36.1 |
60.4 |
89.5 |
IE |
6 |
0.0 |
0.0 |
4.6 |
4.2 |
93.2 |
IT |
52 |
7.5 |
3.5 |
29.9 |
28.5 |
29.8 |
LU |
5 |
1.6 |
0.0 |
28.5 |
29.8 |
70.8 |
NL |
38 |
2.6 |
1.2 |
5.8 |
12.0 |
27.8 |
PT |
8 |
1.8 |
0.8 |
18.0 |
18.4 |
62.0 |
SE |
6 |
1.0 |
0.2 |
18.2 |
18.5 |
159.8 |
EU-15(d)
|
836 |
1.5 |
0.5 |
17.2 |
23.5 |
66.5 |
(a) based on three non-overlapping eight hourly values between
0.00-8.00; 8.00-16.00; 16.00-24.00;
b) based on the eight hourly value between 12.00-20.00;
(c) note that small differences in the number of stations reporting for
each of the threshold levels may occur;
(d) France and Italy not included.
Table 5. Number of days with at least one exceedance observed at the
reporting stations in a Member State. (reference period 1 January - 31 December 1996.
| |
threshold
value (in µg/m3) |
| |
180 1h |
110 8h(b) |
65 24h |
AT |
19 |
147 |
363 |
BE |
12 |
46 |
157 |
DE |
37 |
162 |
361 |
DK |
1 |
27 |
169 |
ES |
60 |
217 |
366 |
FI |
2 |
65 |
320 |
FR |
na |
na |
na |
GB |
12 |
45 |
266 |
GR |
59 |
162 |
239 |
IE |
0 |
12 |
252 |
IT |
na |
na |
na |
LU |
6 |
66 |
166 |
NL |
12 |
30 |
120 |
PT |
12 |
110 |
264 |
SE |
4 |
49 |
287 |
EU-15(a)
|
126 |
248 |
366 |
(a) France and Italy not included;
(b) based on the eight hourly value between 12.00-20.00.


Figure 2. Number of days as function of the minimum number of Member
States where at least one exceedance of a threshold value has been observed (for example,
on 151 days the threshold value of 110 g/m3 has been exceeded in at least 4
Member States); period 1 January - 31 December 1996. Note that information is available
for 13 Member States only.
A further discussion on the reported data for 1996 is given in the
following chapters. Percentile values for previous years (1989-1996) have been reported by
four Member States and are briefly discussed in paragraph 4.5.
Table 6. Range in reported 50-, 98- and 99.9-percentile values and
maximum observed values (based on hourly and moving eight-hourly average concentrations)
observed at individual monitoring stations in Member States (in µg/m3),
period 1 January - 31 December 1996. For France and Italy no information is available
(na); United Kingdom (GB) did not submit statistical information on 8-h average
concentrations.
| |
1h-P50
|
1h-P98
|
1h-P99.9*
|
1h-MAX
|
| |
min |
max |
min |
max |
min |
max |
min |
max |
| AT |
13 |
100 |
83 |
151 |
120 |
213 |
129 |
224 |
| BE |
22 |
49 |
105 |
136 |
159 |
222 |
168 |
243 |
| DE |
9 |
94 |
67 |
172 |
122 |
213 |
128 |
269 |
| DK |
45 |
59 |
102 |
116 |
144 |
164 |
151 |
200 |
| ES |
11 |
90 |
32 |
187 |
55 |
262 |
82 |
335 |
| FI |
33 |
74 |
82 |
129 |
105 |
164 |
134 |
190 |
| FR |
na |
na |
na |
na |
na |
na |
na |
na |
| GB |
12 |
68 |
70 |
130 |
112 |
216 |
56 |
242 |
| GR |
20 |
62 |
87 |
164 |
116 |
301 |
157 |
391 |
| IE |
47 |
72 |
86 |
106 |
na |
na |
124 |
173 |
| IT |
14 |
74 |
50 |
179 |
106 |
233 |
112 |
371 |
| LU |
14 |
61 |
77 |
145 |
118 |
183 |
130 |
199 |
| NL |
15 |
46 |
71 |
121 |
116 |
219 |
133 |
265 |
| PT |
7 |
94 |
24 |
137 |
62 |
175 |
105 |
275 |
| SE |
59 |
69 |
99 |
128 |
117 |
183 |
125 |
210 |
| |
8h-P50
|
8h-P98
|
8h-P99.9*
|
8h-MAX
|
| |
min |
max |
min |
max |
min |
max |
min |
max |
| AT |
17 |
100 |
77 |
149 |
106 |
203 |
120 |
212 |
| BE |
23 |
49 |
95 |
134 |
147 |
192 |
145 |
228 |
| DE |
14 |
93 |
59 |
169 |
107 |
195 |
94 |
230 |
| DK |
45 |
59 |
98 |
113 |
126 |
161 |
134 |
177 |
| ES |
11 |
89 |
27 |
178 |
46 |
237 |
39 |
276 |
| FI |
34 |
74 |
75 |
126 |
99 |
159 |
111 |
164 |
| FR |
na |
na |
na |
na |
na |
na |
na |
na |
| GB |
? |
? |
? |
? |
? |
? |
? |
? |
| GR |
23 |
64 |
80 |
148 |
105 |
231 |
115 |
258 |
| IE |
47 |
73 |
80 |
103 |
na |
na |
117 |
155 |
| IT |
na |
na |
na |
na |
na |
na |
120 |
219 |
| LU |
17 |
61 |
70 |
141 |
102 |
169 |
119 |
179 |
| NL |
16 |
47 |
65 |
111 |
107 |
199 |
112 |
234 |
| PT |
14 |
93 |
56 |
135 |
95 |
159 |
55 |
169 |
| SE |
58 |
69 |
99 |
125 |
115 |
175 |
124 |
192 |
* additional information submitted on a voluntary basis
2In the Information document for Summer 1996 (Sluyter and
van Zantvoort, 1996) an additional exceedance was reported for the station Settignano in
Firenze, Italy (387 µg/m3, on 13-7-1996, 9.00). This observation which was
based on non-validated data, has not been confirmed in the annual reporting (observed
1h-maximum concentration is 225 µg/m3).
3 In this report exceedances are counted on a daily basis,
that is, a day on which at least one 1h- or 8h-concentration exceeds the threshold value,
is marked as an exceedance.
4 Annex I is only available in computer readable form. In
this report a description of the tables in Annex I is provided. Upon request to the ETC-AQ
a diskette containing the Annex will be made available (e-mail address: frank.de.leeuw@rivm.nl; fax + 31 30 228 75 31).


Document Actions
Share with others