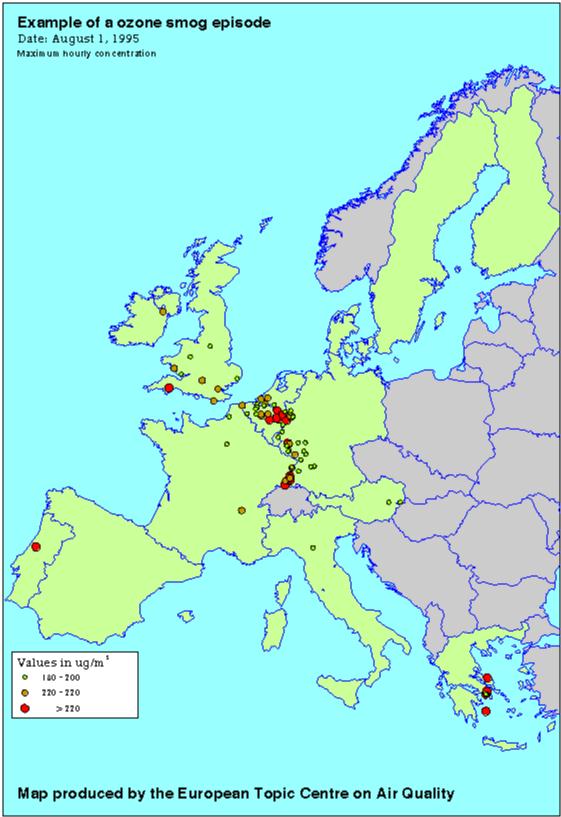
Map 13: Example of Ozone smog Episode
Example of an Ozone Smog Episode
Map 13. Example of an ozone smog episode: hourly ozone
concentrations in excess of 180 µg/m3 as measured on 1 August
1995.
Permalinks
- Permalink to this version
- df4924453438b5584b03e791a96750f8
- Permalink to latest version
- BAG0CEIU7R
For references, please go to https://www.eea.europa.eu/publications/C1I92-9167-074-X/page038.html or scan the QR code.
PDF generated on 30 Jan 2023, 11:38 PM
Document Actions
Share with others