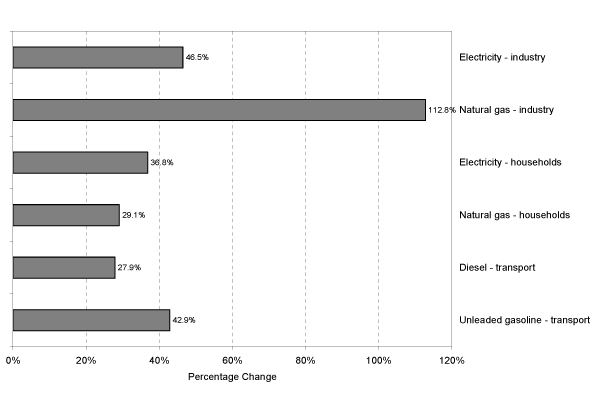
Tax changes are between 1991 and 2005 for gasoline and diesel and between 1991 and 2006 for electricity and gas. Eurostat collects price data on gas and electricity for different consumer categories (see metadata) and presents these in three forms: 1) prices without taxes, 2) prices without VAT and 3) prices with all taxes included. The tax component of energy prices for households is calculated by subtracting prices without taxes from prices including all taxes. For industry, it is calculated by subtracting prices without taxes from prices without VAT. Data for the transport fuels is provided by DG TREN (European Commission) in a similar form and the same calculations as for households are applied. All taxes have been deflated to constant prices using the 1995 GDP deflator.


Document Actions
Share with others