Case study: The combination of multiple geographically-explicit data on a grid for France
This case study presents how France implemented a new geographically-explicit method to move from Approach 2 to Approach 3 for land representation. This method combines several national and European datasets within a high-resolution grid, using hierarchy rules and correspondence between nomenclatures.
France has recently migrated to a geographically-explicit monitoring of land uses in response to national expectations. Formerly the French inventory was based on an exhaustive national survey of land uses named ‘Teruti’, that was the single data source used for land use monitoring. The change from a survey system to a geographically-explicit system was done to overcome challenges with understanding land use changes. The geographically-explicit system was built to facilitate quality control of GHG inventories, understanding of land use changes and better management of lands.
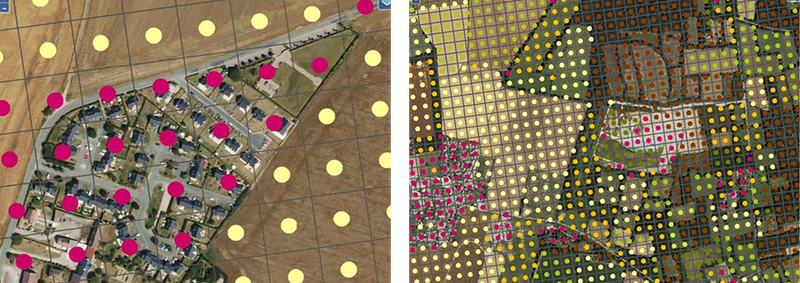
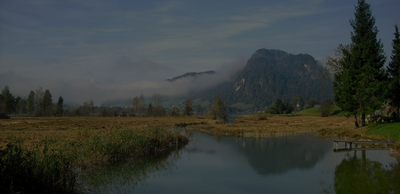
Figure 1: An example of a grid-based approach in France
Source: Citepa (https://www.citepa.org/), France’s visualisation tool of land use of LULUCF inventory, 2023.
The following steps were followed to build the geographically-explicit system:
A grid was placed over France and intersected with several maps, so that heterogeneous datasets, even having different spatial resolutions, could be combined.
The spatial resolution of the grid was chosen to fit the minimal threshold for the national definition of Forest (0.5ha), and to fit the scale of usual land use change such as small-scale urbanization.
Maps at a specific time were chosen as a reference for each land use type. For instance, forest maps (around year 2015) were prioritized for forest while LPIS data from 2021 was chosen for agricultural lands.
Strict hierarchy rules between datasets have been defined so that the choice of the most relevant datasets is automatically made for each plot.
Products that focus on land-use and/or land-cover changes were prioritized for the monitoring of actual land use change.
Strict consistency rules have been defined so that the estimation of land use change reflects as much as possible actual change, and not map artefacts.
Years in which land use change occurred were derived from the time periods covered by the datasets (randomly on the period).
Land use changes were extrapolated for years not covered by maps. Estimations were made for years prior to the first available map, and for years after the last available map.
The system was designed so that an annual time series of land use for each cell of the grid is produced.
Corrections or post-adjustments were made, when needed, to ensure consistency with other reference datasets such as NFI areas or Agricultural census.
A GIS portal was established to visualize the results and allow for verification processes.
France’s geographically-explicit inventory is recent and will be improved in the coming years by considering new products and developing additional controls on land use monitoring. It is already a significant improvement and opportunity to efficiently monitor policy action at national and local level.
Iceland still lacks country specific data for applying higher tier methodologies and approaches, especially for grasslands, croplands and wetlands. A case study presents how the country established an “improvement group” for advancing GHG reporting.
Moving to higher tiers often requires moving from default emissions factors and parameters, using more relevant values from national or regional studies. This case study presents how a regional project covering European Mediterranean countries developed information on carbon stocks and fluxes for living biomass in cropland and grasslands to improve the LULUCF monitoring in this region with specific ecological conditions.
Croatia needed to develop a geographically-explicit approach for land monitoring. This case study presents a LIFE-funded project that is aimed at creating such approach, using different earth observation products. The creation of a national land-use change timeseries has many policy implications for Croatia.
According to UNFCCC rules, LULUCF reporting from grassland and cropland should include the impact of trees and other woody vegetation . Trees on agricultural land in the EU have significant biomass production, which is not consistently recorded in the GHG inventories of Member States. Nor are Trees outside forests consistently reported in the GHG inventories of Member States.
Environmental policies are often based on a benchmark: maximum level of pollution allowed threshold above which further action is subsidized, etc. Improving the local relevance of the benchmark increases the cost-efficiency of a policy. Denmark has already applied this rationale to two environmental policies: peatland rewetting and nitrogen limits.
Like many countries, Canada was confronted with the challenges of timely reporting and the combining of multiple datasets for estimating forest emissions and removals. To address these challenges, Canada developed the Carbon Budget Model of the Canadian Forest Sector (CBM-CFS3) . It is a complex Tier 3 model that can be used for other purposes and by other stakeholders (e.g. projections, harvest strategy, fire prevention).
As many countries, France has an efficient forest inventory which provides accurate estimates of tree growth, harvest and mortality. The associated drawback is a coarse time resolution which hinders appropriation of the reported data by policy makers. To bridge this gap, a simple model combining 5-yearly forest inventory data with annual statistics was developed , allowing meaningful annual estimates which, among others, reflect dramatic events such as storms in the time series.
Over the past few years in France, farmers have received incentives to define the GHG budget of their farm and identify climate mitigation levers through numerous channels. However, the synergies with the national GHG inventory and public policies are still underexploited.
A discrepancy of 500,000 ha in forest area in Romania was found when comparing national legal forest maps and National Forest Inventory information. This case study describes how Romania has set up a multi-data integration system to more accurately assess time series of forest cover dynamics.
Portugal has developed its own land use and land-use change map that is a good example of a geographically-explicit approach to monitoring areas for the LULUCF inventory with a temporal consistency. This case study also presents Portugal’s method to cover past periods.
To visualize priority areas for the LULUCF monitoring and mitigation actions, various environmental geospatial products are available from national, European or international products. In this case study, we present Italy’s national portal that displays such maps.
Agricultural use of organic soils contributes substantially to GHG emissions from organic soils. The Austrian Environment Agency addresses these questions in a project aiming to improve the estimates of drained organic soils in the Austrian National GHG Inventory
Ireland has experienced a fast evolution of methodology of the reporting of GHGs from grassland and wetlands that was influenced by a close collaboration between the communities of GHG reporting and research. A basis for this is the involvement of GHG inventory staff members in research projects as discussed by this case study.
Iceland still lacks country specific data for applying higher tier methodologies and approaches, especially for grasslands, croplands and wetlands. A case study presents how the country established an “improvement group” for advancing GHG reporting.
Moving to higher tiers often requires moving from default emissions factors and parameters, using more relevant values from national or regional studies. This case study presents how a regional project covering European Mediterranean countries developed information on carbon stocks and fluxes for living biomass in cropland and grasslands to improve the LULUCF monitoring in this region with specific ecological conditions.
Croatia needed to develop a geographically-explicit approach for land monitoring. This case study presents a LIFE-funded project that is aimed at creating such approach, using different earth observation products. The creation of a national land-use change timeseries has many policy implications for Croatia.