Case study: Farm-level GHG assessments and their link with national monitoring and policies in France
Over the past few years in France, farmers have received incentives to define the GHG budget of their farm and identify climate mitigation levers through numerous channels. However, the synergies with the national GHG inventory and public policies are still underexploited.
Four incentives to undertake a farm-level GHG budget
French farmers have been asked and subsidized to determine a GHG budget of their farms through four different channels: research projects, carbon offsetting, supply-chain premiums, and subsidized carbon diagnosis.
Research projects
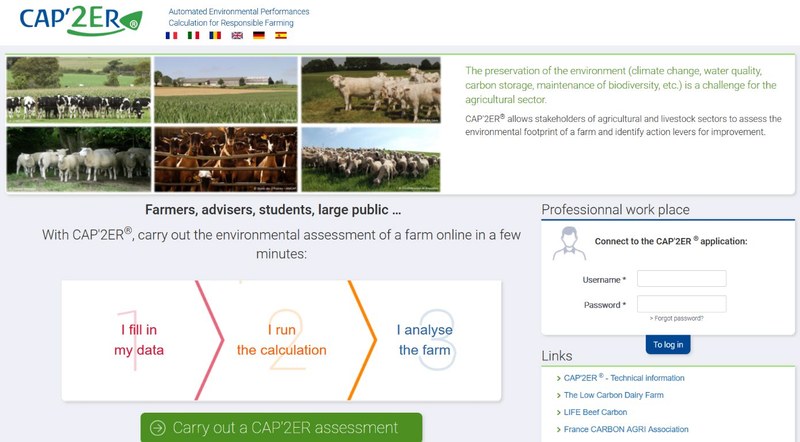
Since the beginning of the 2010s, the technical institute for livestock (IDELE) has been developing farm-level GHG budgets as part of several LIFE and EIP research projects, for example Carbon Dairy, Beef Carbon, Green Sheep, Carbon Farming, Climate Farm Demo. Overall, IDELE has now developed more than 30,000 GHG budgets in livestock farms. These assessments were used both to advise farmers on how to improve their GHG budget and to refine the Institute’s GHG assessment tool CAP’ER.
Figure 1: Webpage of CAP’2ER, one of the most frequently used farm-level GHG calculators in France
Certification of greenhouse gas reduction and carbon sequestration projects
In 2018, the French ministry for the Environment launched the “Label Bas Carbone”, a domestic voluntary certification scheme for greenhouse gas reduction and carbon sequestration projects, delivering credits that can be valued on voluntary markets. The launch was quickly followed by the validation of sub-sector specific methodologies to quantify emission reductions and storage increase at farm level. Each methodology is required to produce a calculator, which may be either a spreadsheet file or a program. It turns out that most of these calculators are comprehensive: they estimate the GHG budget of the entire farm as well as its mitigation levers.
Farmers can perform a quick when they start thinking about certifying their emission reductions, but they are also being approached by cooperatives and start-ups providing advisory services, ranging from a GHG budget to the sale of offset credits resulting from certified and verified improvements. As of February 2024, close to 2,000 farms were engaged in a Label Bas-Carbone project involving the whole farm, and therefore requiring at least two farm-level GHG assessments.
Supply chain premiums
In 2020, Saipol, a biodiesel manufacturer, started to offer a “GHG bonus” to farmers who could demonstrate a low carbon footprint for rapeseed. This move was triggered by the European Renewable Energy Directive (RED II) which mandates that the GHG budget of biofuels be at least 50% lower than its fossil counterpart. Interested farmers are invited to fill in a few variables online for both 2008 and the current year. On this basis, their cooperative may contact them to verify the numbers, advise them on how to reduce their GHG footprint and offer them a contract. for their . This “low GHG rapeseed” is paid with a 0-50 € premium per ton of rapeseed, depending on the verified GHG budget, which is up to 10% of the 2023 rapeseed price. A document-based audit is conducted on all farms to corroborate areas, yield and nitrogen inputs based on CAP declarations, accounting books and fertilization books.
Since then, other supply chains have started offering premiums such as Nestle on popcorn maize, Danone and Sodiaal on milk or Cristal Union on beetroots.
Subsidized carbon diagnosis
From 2021 to 2023, as part of the Covid recovery plan, the Agriculture Ministry and the French environment agency (ADEME) subsidized 90% of the cost of farm-level GHG assessments . 700 farm advisors were trained to perform GHG assessments, and 3,400 assessments were undertaken for a total initial budget of 10 million euros. 25% of the farms assessed were then willing to undertake a Label Bas Carbone project to obtain funding for reducing GHG emissions or increasing carbon storage. This positive experience encouraged the Agriculture Ministry to renew the scheme with a few changes in 2024, with a budget of 32 million euros. On top of this, some regional councils and private firms are also subsidizing farm-level carbon diagnosis, audit or advice.
Limited links with national monitoring and national policies
All in all, the various incentives for farm-level GHG assessments have now led to more than 30,000 farm-level assessment, together with the generation of an ecosystem of competent companies and advisors to perform them. The synergy with the national greenhouse gas inventory and national policies remains limited, although a few links exist.
Policy-wise, most French regions have started to offer a “Low Carbon” Agri-Environmental and based on farm-level GHG assessment. This Agri-Environmental and Climatic Measure offers a 18,000 euros payment to farms which manage to reduce emissions by at least 15% within five years. Both the target and the amount are based on feedback from Label Bas-Carbone projects and the calculators eligible to verify the reductions are also taken from Label Bas-Carbone methodologies. The Nouvelle-Aquitaine region which pioneered the scheme enrolled 18 farms in 2023, four of which had benefited from a subsidized carbon diagnosis.
Regarding monitoring however, there is no link with the national greenhouse gas inventory, although CITEPA – the agency in charge of the national GHG inventory – has a statutory seat in the technical committee in charge of validating Label Bas Carbone methodologies. More promisingly, cooperatives and start-ups involved in farm-level GHG assessments are increasingly using data collected for Common Agricultural Policy payments to streamline the assessments and target farms with the most promising potential for GHG abatement.
There is however a bright side to this lack of link with the GHG inventory: no time is lost in wondering whether the abatement obtained at farm level will be 100% captured by the inventory. On this aspect, France may have been learning from past mistakes. During the first commitment period of the Kyoto Protocol (2008-2012), the Environment ministry spent a lot of energy checking that the locally monitored abatement of the domestic carbon offsetting scheme (“Projets domestiques CO2”) was captured by the national accounting system, and rejected all projects where this was not the case, thereby rejecting some worthy projects due to pitfalls in the national accounting system.
Iceland still lacks country specific data for applying higher tier methodologies and approaches, especially for grasslands, croplands and wetlands. A case study presents how the country established an “improvement group” for advancing GHG reporting.
Moving to higher tiers often requires moving from default emissions factors and parameters, using more relevant values from national or regional studies. This case study presents how a regional project covering European Mediterranean countries developed information on carbon stocks and fluxes for living biomass in cropland and grasslands to improve the LULUCF monitoring in this region with specific ecological conditions.
Croatia needed to develop a geographically-explicit approach for land monitoring. This case study presents a LIFE-funded project that is aimed at creating such approach, using different earth observation products. The creation of a national land-use change timeseries has many policy implications for Croatia.
According to UNFCCC rules, LULUCF reporting from grassland and cropland should include the impact of trees and other woody vegetation . Trees on agricultural land in the EU have significant biomass production, which is not consistently recorded in the GHG inventories of Member States. Nor are Trees outside forests consistently reported in the GHG inventories of Member States.
Environmental policies are often based on a benchmark: maximum level of pollution allowed threshold above which further action is subsidized, etc. Improving the local relevance of the benchmark increases the cost-efficiency of a policy. Denmark has already applied this rationale to two environmental policies: peatland rewetting and nitrogen limits.
Like many countries, Canada was confronted with the challenges of timely reporting and the combining of multiple datasets for estimating forest emissions and removals. To address these challenges, Canada developed the Carbon Budget Model of the Canadian Forest Sector (CBM-CFS3) . It is a complex Tier 3 model that can be used for other purposes and by other stakeholders (e.g. projections, harvest strategy, fire prevention).
As many countries, France has an efficient forest inventory which provides accurate estimates of tree growth, harvest and mortality. The associated drawback is a coarse time resolution which hinders appropriation of the reported data by policy makers. To bridge this gap, a simple model combining 5-yearly forest inventory data with annual statistics was developed , allowing meaningful annual estimates which, among others, reflect dramatic events such as storms in the time series.
A discrepancy of 500,000 ha in forest area in Romania was found when comparing national legal forest maps and National Forest Inventory information. This case study describes how Romania has set up a multi-data integration system to more accurately assess time series of forest cover dynamics.
Portugal has developed its own land use and land-use change map that is a good example of a geographically-explicit approach to monitoring areas for the LULUCF inventory with a temporal consistency. This case study also presents Portugal’s method to cover past periods.
This case study presents how France implemented a new geographically-explicit method to move from Approach 2 to Approach 3 for land representation. This method combines several national and European datasets within a high-resolution grid, using hierarchy rules and correspondence between nomenclatures.
To visualize priority areas for the LULUCF monitoring and mitigation actions, various environmental geospatial products are available from national, European or international products. In this case study, we present Italy’s national portal that displays such maps.
Agricultural use of organic soils contributes substantially to GHG emissions from organic soils. The Austrian Environment Agency addresses these questions in a project aiming to improve the estimates of drained organic soils in the Austrian National GHG Inventory
Ireland has experienced a fast evolution of methodology of the reporting of GHGs from grassland and wetlands that was influenced by a close collaboration between the communities of GHG reporting and research. A basis for this is the involvement of GHG inventory staff members in research projects as discussed by this case study.
Iceland still lacks country specific data for applying higher tier methodologies and approaches, especially for grasslands, croplands and wetlands. A case study presents how the country established an “improvement group” for advancing GHG reporting.
Moving to higher tiers often requires moving from default emissions factors and parameters, using more relevant values from national or regional studies. This case study presents how a regional project covering European Mediterranean countries developed information on carbon stocks and fluxes for living biomass in cropland and grasslands to improve the LULUCF monitoring in this region with specific ecological conditions.
Croatia needed to develop a geographically-explicit approach for land monitoring. This case study presents a LIFE-funded project that is aimed at creating such approach, using different earth observation products. The creation of a national land-use change timeseries has many policy implications for Croatia.