All official European Union website addresses are in the europa.eu domain.
See all EU institutions and bodiesAn official website of the European Union | How do you know?
Environmental information systems
EN
Environmental policies are often based on a benchmark: maximum level of pollution allowed threshold above which further action is subsidized, etc. Improving the local relevance of the benchmark increases the cost-efficiency of a policy. Denmark has already applied this rationale to two environmental policies: peatland rewetting and nitrogen limits.
High resolution maps of land use and organic soils (source: Danish National Inventory Report, 2023)
The Danish LULUCF inventory combines multiple high-resolution datasets to monitor land use change, organic soils, and to perform the carbon fluxes calculation. The following datasets are used:
- a complete wall-to-wall mapping of Denmark at 25*25 m pixel level;
- various geographically-explicit data sources, such as detailed map information on housing and road construction;
- digital maps for subsidy schemes on afforestation on Cropland and Grassland with the exact position of the afforested areas;
- National Forest Inventory (NFI) starting in 2002 based on 2*2 km grid squares;
- EU subsidy related annual digital registration of farmers’ own crops at field level (EU Land Parcel Information System or LPIS), for dynamic modelling of carbon stock in agricultural soils;
- map of the organic soils, in a GIS overlay combined with the annual field position;
- Danish topographical maps (digital elevation model) for predicting hedges and other biotopes not qualified as forest;
- digital maps with exact position where wetland restoration is taking place;
- and others.
Figure 1: Land use in Denmark 2021 (on the left) and organic soil map (on the right) for Denmark 2010
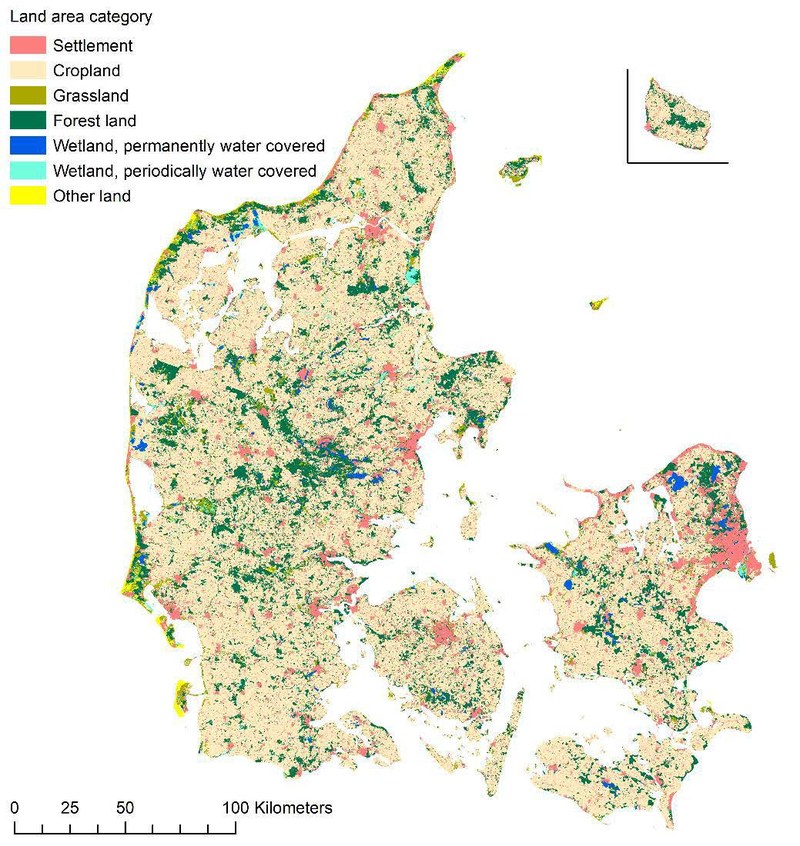
Based on IPCC land use categories
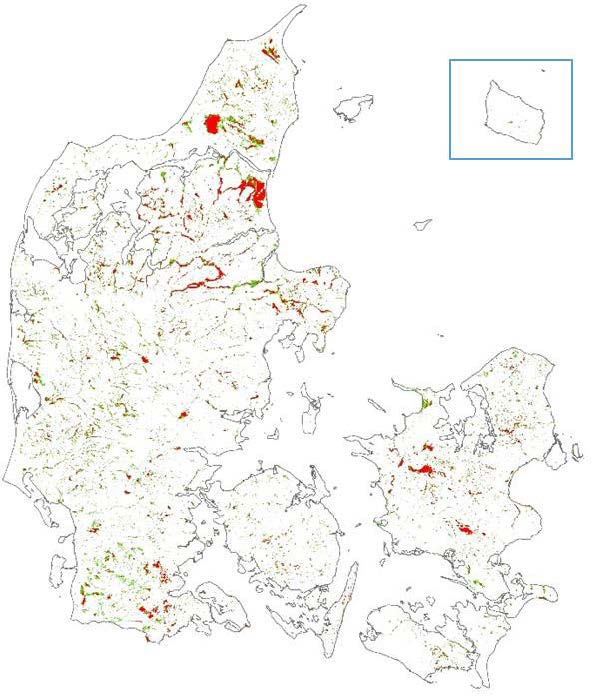
Organic soil map for Denmark year 2010
Source: Levin & Gyldenkærne, 2022 and Greve et al., 2014. Green colour indicates soils with 6-12% of organic carbon and red colour indicates soils with more than 12% of organic carbon.
Since 2011, the availability of yearly spatially-explicit information allows for the assessment of annual changes in land-use at parcel level. This high spatial and temporal resolution increases the artefacts resulting from misclassification.
To reduce these artefacts, improbable sequences of land-use changes (e.g. changes from Settlement to other land-uses) and too short durations in a given land use (e.g. fewer than 2 years as forest) invalidate some of the detected changes. In addition, land-use changes that add up to fewer than 8 cells (0.5ha) in a given region are ignored.
Data since 2011
- Since 2011, the availability of yearly spatially-explicit information allows for the assessment of annual changes in land-use at parcel level.
- This high spatial and temporal resolution increases the artefacts resulting from misclassification. To reduce these artefacts, improbable sequences of land-use changes (e.g. changes from Settlement to other land-uses) and too short durations in a given land use (e.g. fewer than 2 years as forest) invalidate some of the detected changes.
- In addition, land-use changes that add up to fewer than 8 cells (0.5ha) in a given region are ignored.
Pre-2011 assessment (1990–2011)
- As every country, Denmark must deal with the differences of resolution between periods and products. From 1990 to 2011, the assessment is based on a baseline map of land categories for the year 2011 and subsequent backward mapping for the years 2005 and 1990.
- Since field parcel maps and topographic data are not available for the years 1990 and 2005, the assessment of land categories for these years are based on various other datasets and products, such as Landsat images, agricultural information, cadastre maps, Danish Building register, Danish Areal Information System (AIS).
Organic soils mapping
- Mapping organic soils has been a specific focus, with 10,000 points inventoried in 2009/10 and 1,000 points revisited in 2022. This large sample allowed to train a model with high resolution variables (altitude, land use, geology, climate and groundwater depth), resulting in a 10 m resolution map of organic soils (Greve, 2023).
Use of high-resolution maps in environmental policies
These high-resolution maps are then used to optimize the efficiency of environmental policies. The map of organic soils, for example, is the default basis to assess the eligibility of landowners to peatland rewetting subsidies:
60% “carbon-rich soil”
At least 60% of the rewetted area has to be a “carbon-rich soil” (organic content higher than 6%).
- Interestingly, ineligible landowners, land managers and public authorities are allowed to challenge the map on the basis of soil measurements in their parcels, potentially feeding back more measurements into the GHG inventory and its maps.
- The expected emissions reductions from rewetting are estimated through a calculator designed by Aarhus University, and funding is prioritized towards the most efficient projects (in euros per avoided tCO2e).
32 million € budget
In 2023, 32 million euros were budgeted for this subsidy scheme:
- with 7 million euros prioritizing climate mitigation (rewetting of “carbon-rich soils”)
- 25 million euros prioritizing “nitrogen wetland” creation (wetlands allowing the reduction nitrogen run-off by an average 90 kg N/ha)16
Another such example, although primarily aimed at water quality rather than climate mitigation, is nitrogen limits.
All over Denmark, the amount of allowed nitrogen application is capped. But instead of setting a national maximum level, the cap is different for each crop on the 12 soil types88F88F80F80F17, depending on production potential. In addition, voluntary schemes at catchment scale provide incentives to further limit nitrogen run-off through various measures including catch crops. There again, these subsidies are prioritized based on the efficiency nitrogen run-off mitigation, expressed in hectare of catch crop equivalent and a map with five classes for soil nitrogen retention capacity. In both cases, the policies are based on high resolution national soil maps and calculations.
Next steps and cautionary remarks
Research is being funded with these policies in mind, thereby trying to get high resolution information on as many environmentally relevant variables as possible. Denmark is also mulling over a tax on wetland drainage, possibly based on improvements in monitoring both wetland area and water table depth.
The synergy between GHG inventory improvements and effective policies comes however with nuance and cautionary remarks. Danish representatives point out that while improved GHGI can help designing more effective policies, they are not a cornerstone of mitigation policies and certainly should not fuel inaction along the lines that because an action is not captured in the GHGI, it is not worth funding or mandating.
Other case studies

According to UNFCCC rules, LULUCF reporting from grassland and cropland should include the impact of trees and other woody vegetation . Trees on agricultural land in the EU have significant biomass production, which is not consistently recorded in the GHG inventories of Member States. Nor are Trees outside forests consistently reported in the GHG inventories of Member States.

Like many countries, Canada was confronted with the challenges of timely reporting and the combining of multiple datasets for estimating forest emissions and removals. To address these challenges, Canada developed the Carbon Budget Model of the Canadian Forest Sector (CBM-CFS3) . It is a complex Tier 3 model that can be used for other purposes and by other stakeholders (e.g. projections, harvest strategy, fire prevention).
As many countries, France has an efficient forest inventory which provides accurate estimates of tree growth, harvest and mortality. The associated drawback is a coarse time resolution which hinders appropriation of the reported data by policy makers. To bridge this gap, a simple model combining 5-yearly forest inventory data with annual statistics was developed , allowing meaningful annual estimates which, among others, reflect dramatic events such as storms in the time series.