Case study: ‘Tree-deserts’ in Europe and their future carbon-capture potential
ImageEU DigitAF project by Planet Inc and the European Forest Institute
According to UNFCCC rules, LULUCF reporting from grassland and cropland should include the impact of trees and other woody vegetation. Trees on agricultural land in the EU have significant biomass production, which is not consistently recorded in the GHG inventories of Member States. Nor are Trees outside forests consistently reported in the GHG inventories of Member States.
Data collected by FAO for the 5-yearly Forest Resource Assessment often lacks data in the categories of “Other wooded land” or “Other land with tree cover”, and, even when provided, only records areas with trees extending 0.5 ha.
Scope for large-scale afforestation in the EU is limited by the need to conserve agricultural land, yet agroforestry allows isolated trees, hedges, and tree lines to be established on land which remains in agricultural production, while increasing the carbon content and soil-fertility.
Agroforestry has significant potential to contribute to the EU LULUCF target by 2030.
EURAF14 calculates that there are 95.2 Mha of cropland and pastureland in the EU-27 that are devoid of trees, and 117.9 Mha with less than 10% tree crown cover.
Bringing these areas to the 10% tree crown cover threshold would mean planting 11.2 Mha of agroforestry (or 750,000 ha/a between 2025 and 2040).
Assuming an average sequestration rate of 5 t CO2/ha/a for agroforestry on mineral soils, including both above and below ground sequestration, 56 Mt CO2 could be sequestered over the lifetime of the trees - which is typically 20-40 years.
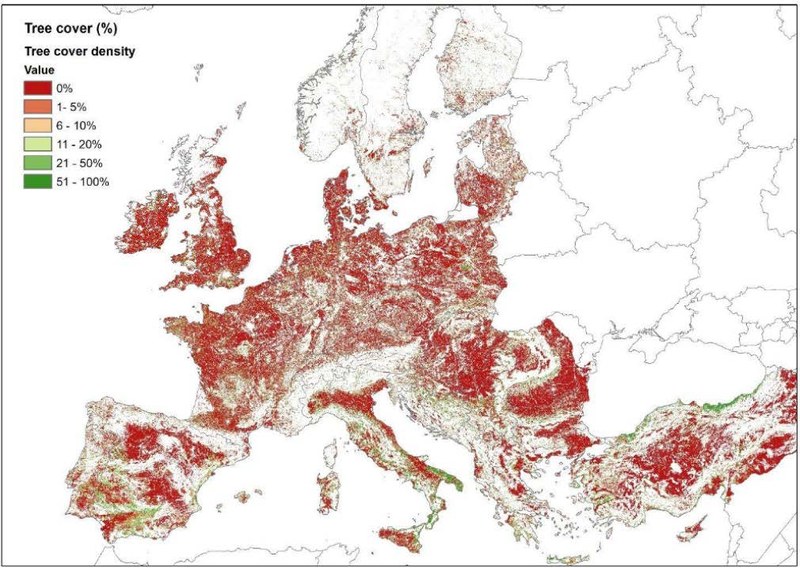
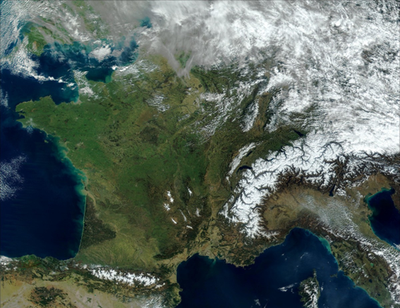
Tree-Cover-Density (TCD) on grassland/cropland land in the 39 EEA countries
Figure 1: Tree-Cover-Density (TCD) on grassland/cropland land in the 39 EEA countries.
Areas of white are non-agricultural land. Red areas are priority planting zones where TCD is particularly low.
Source: Copernicus TCD-2018 superimposed on Corine agricultural land for 2018. Each pixel covers 1 ha (100 m x 100 m). The map was produced as part of the EU DigitAF project by Planet Inc and the European Forest Institute.
Work by the has mapped the distribution tree crown cover on grassland/cropland over the EU-27, and also identified the NUTS-3 regions that have lowest tree cover on this type of agriculture (i.e. excluding permanent crops like olives).
The next stage for DigitAF is to use country-specific data in national Land Parcel Identification Systems to identify the distribution of woody landscape features, and devise CAP results-based payment schemes for agroforestry, linked to CAP measures and to voluntary carbon certification.
IPCC Tier 3 modelling of emissions and removals using Approach 3 with LPIS data will allow national reporting of LULUCF to include the attempts being made by individual farmers to reduce emissions on their holdings.
Iceland still lacks country specific data for applying higher tier methodologies and approaches, especially for grasslands, croplands and wetlands. A case study presents how the country established an “improvement group” for advancing GHG reporting.
Moving to higher tiers often requires moving from default emissions factors and parameters, using more relevant values from national or regional studies. This case study presents how a regional project covering European Mediterranean countries developed information on carbon stocks and fluxes for living biomass in cropland and grasslands to improve the LULUCF monitoring in this region with specific ecological conditions.
Croatia needed to develop a geographically-explicit approach for land monitoring. This case study presents a LIFE-funded project that is aimed at creating such approach, using different earth observation products. The creation of a national land-use change timeseries has many policy implications for Croatia.
Environmental policies are often based on a benchmark: maximum level of pollution allowed threshold above which further action is subsidized, etc. Improving the local relevance of the benchmark increases the cost-efficiency of a policy. Denmark has already applied this rationale to two environmental policies: peatland rewetting and nitrogen limits.
Like many countries, Canada was confronted with the challenges of timely reporting and the combining of multiple datasets for estimating forest emissions and removals. To address these challenges, Canada developed the Carbon Budget Model of the Canadian Forest Sector (CBM-CFS3) . It is a complex Tier 3 model that can be used for other purposes and by other stakeholders (e.g. projections, harvest strategy, fire prevention).
As many countries, France has an efficient forest inventory which provides accurate estimates of tree growth, harvest and mortality. The associated drawback is a coarse time resolution which hinders appropriation of the reported data by policy makers. To bridge this gap, a simple model combining 5-yearly forest inventory data with annual statistics was developed , allowing meaningful annual estimates which, among others, reflect dramatic events such as storms in the time series.
Over the past few years in France, farmers have received incentives to define the GHG budget of their farm and identify climate mitigation levers through numerous channels. However, the synergies with the national GHG inventory and public policies are still underexploited.
A discrepancy of 500,000 ha in forest area in Romania was found when comparing national legal forest maps and National Forest Inventory information. This case study describes how Romania has set up a multi-data integration system to more accurately assess time series of forest cover dynamics.
Portugal has developed its own land use and land-use change map that is a good example of a geographically-explicit approach to monitoring areas for the LULUCF inventory with a temporal consistency. This case study also presents Portugal’s method to cover past periods.
This case study presents how France implemented a new geographically-explicit method to move from Approach 2 to Approach 3 for land representation. This method combines several national and European datasets within a high-resolution grid, using hierarchy rules and correspondence between nomenclatures.
To visualize priority areas for the LULUCF monitoring and mitigation actions, various environmental geospatial products are available from national, European or international products. In this case study, we present Italy’s national portal that displays such maps.
Agricultural use of organic soils contributes substantially to GHG emissions from organic soils. The Austrian Environment Agency addresses these questions in a project aiming to improve the estimates of drained organic soils in the Austrian National GHG Inventory
Ireland has experienced a fast evolution of methodology of the reporting of GHGs from grassland and wetlands that was influenced by a close collaboration between the communities of GHG reporting and research. A basis for this is the involvement of GHG inventory staff members in research projects as discussed by this case study.
Iceland still lacks country specific data for applying higher tier methodologies and approaches, especially for grasslands, croplands and wetlands. A case study presents how the country established an “improvement group” for advancing GHG reporting.
Moving to higher tiers often requires moving from default emissions factors and parameters, using more relevant values from national or regional studies. This case study presents how a regional project covering European Mediterranean countries developed information on carbon stocks and fluxes for living biomass in cropland and grasslands to improve the LULUCF monitoring in this region with specific ecological conditions.
Croatia needed to develop a geographically-explicit approach for land monitoring. This case study presents a LIFE-funded project that is aimed at creating such approach, using different earth observation products. The creation of a national land-use change timeseries has many policy implications for Croatia.