Case study: A verified and timely Tier 3 model serving multiple purposes beyond the inventory in Canada
Like many countries, Canada was confronted with the challenges of timely reporting and the combining of multiple datasets for estimating forest emissions and removals. To address these challenges, Canada developed the Carbon Budget Model of the Canadian Forest Sector (CBM-CFS3). It is a complex Tier 3 model that can be used for other purposes and by other stakeholders (e.g. projections, harvest strategy, fire prevention).
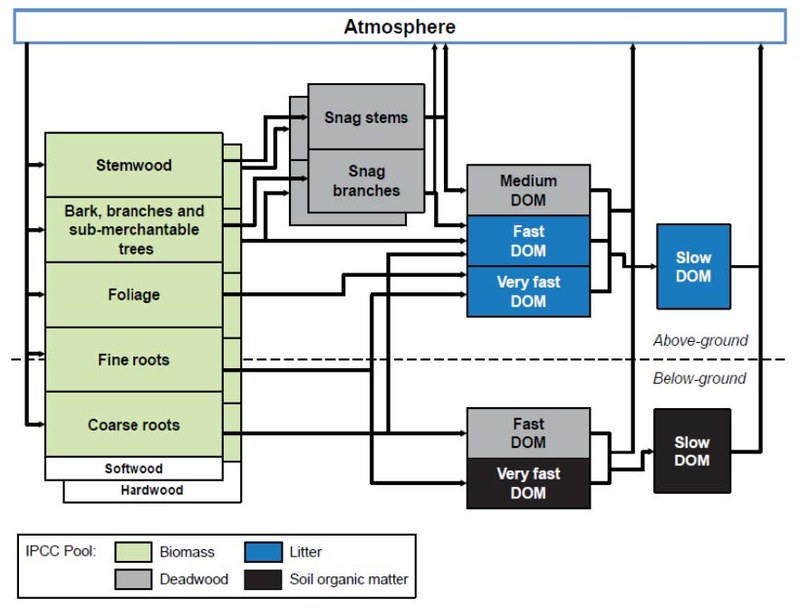
CBM-CFS3 has been used for more than 10 years to report all emissions and removals related to forests. NFI data on living biomass, dead wood and soil carbon has been used to calibrate and verify the CBM-CFS3 model using Bayesian assimilation methods to optimize the fit between model and data. The model was explicitly designed to be used for the GHG inventory, thereby taking care to align pools and fluxes with IPCC language.
Figure 1: Carbon Pools and Transfers Simulated by CBM-CFS3
Source: Canadian NIR, 2023
Pro-active applications
Since it is a model, CBM-CFS3 can also be run pro-actively to make projections of forest-related emissions and removals (e.g. Smyth et al. 2014; Pilli et al. 2017), with the obvious benefit that these projections are intrinsically compatible with the GHG inventory, which is often a pitfall in projection studies.
This is a useful ‘built-in’ potential for re-use which raises interest for the GHG inventory beyond inventory compilers and reviewers to a broader array of policymakers and stakeholders.
Reliable estimations and projections of standing volumes and other variables are essential for harvest strategies, fire prevention, forest management policies, climate mitigation strategies (e.g. Smyth et al., 2017) and offset projects certification.
A similar re-use of GHG inventory models for projections can be observed in other countries (e.g. Switzerland, Keel 2023).
The Canadian Forest Service has also invested in the dissemination of CBM-CFS3 to both academics and forest managers, making the model freely downloadable as well as providing documentation and training for its use. This wide re-use potential builds a strong case for the Canadian Forest Service to keep investing in the maintenance and improvement of this part of the GHG inventory. A spatially-explicit version of the model which produces maps as well as tables has recently been made .
Continuous improvement
Improvement is always needed. The improvement plan for CBM-CFS3 contains 31 items. However, as we are moving further away from the conditions of the 1990s, CBM-CFS3 and its use in the inventory will need to be recalibrated on more recent NFI data or, even better, evolve towards a more integrated framework. For example, it could assimilate NFI data as it becomes available, so that the estimates remain consistent with actual measurements along the entire reported time-series.
The theme of forest inventory updates is prominent.
Indeed, the model has been calibrated over NFI data from the 1990s and validated on NFI plots from the early 2000s.
This was a very adequate approach as long as climate and management practices could reasonably be assumed to be similar to the 1990s, hence CBM-CFS3 has been a showcase for Tier 3.
However, as we are moving further away from the conditions of the 1990s, CBM-CFS3 and its use in the inventory will need to be recalibrated on more recent NFI data or, even better, evolve towards a more integrated framework. For example, it could assimilate NFI data as it becomes available, so that the estimates remain consistent with actual measurements along the entire reported time-series.
Iceland still lacks country specific data for applying higher tier methodologies and approaches, especially for grasslands, croplands and wetlands. A case study presents how the country established an “improvement group” for advancing GHG reporting.
Moving to higher tiers often requires moving from default emissions factors and parameters, using more relevant values from national or regional studies. This case study presents how a regional project covering European Mediterranean countries developed information on carbon stocks and fluxes for living biomass in cropland and grasslands to improve the LULUCF monitoring in this region with specific ecological conditions.
Croatia needed to develop a geographically-explicit approach for land monitoring. This case study presents a LIFE-funded project that is aimed at creating such approach, using different earth observation products. The creation of a national land-use change timeseries has many policy implications for Croatia.
According to UNFCCC rules, LULUCF reporting from grassland and cropland should include the impact of trees and other woody vegetation . Trees on agricultural land in the EU have significant biomass production, which is not consistently recorded in the GHG inventories of Member States. Nor are Trees outside forests consistently reported in the GHG inventories of Member States.
Environmental policies are often based on a benchmark: maximum level of pollution allowed threshold above which further action is subsidized, etc. Improving the local relevance of the benchmark increases the cost-efficiency of a policy. Denmark has already applied this rationale to two environmental policies: peatland rewetting and nitrogen limits.
As many countries, France has an efficient forest inventory which provides accurate estimates of tree growth, harvest and mortality. The associated drawback is a coarse time resolution which hinders appropriation of the reported data by policy makers. To bridge this gap, a simple model combining 5-yearly forest inventory data with annual statistics was developed , allowing meaningful annual estimates which, among others, reflect dramatic events such as storms in the time series.
Over the past few years in France, farmers have received incentives to define the GHG budget of their farm and identify climate mitigation levers through numerous channels. However, the synergies with the national GHG inventory and public policies are still underexploited.
A discrepancy of 500,000 ha in forest area in Romania was found when comparing national legal forest maps and National Forest Inventory information. This case study describes how Romania has set up a multi-data integration system to more accurately assess time series of forest cover dynamics.
Portugal has developed its own land use and land-use change map that is a good example of a geographically-explicit approach to monitoring areas for the LULUCF inventory with a temporal consistency. This case study also presents Portugal’s method to cover past periods.
This case study presents how France implemented a new geographically-explicit method to move from Approach 2 to Approach 3 for land representation. This method combines several national and European datasets within a high-resolution grid, using hierarchy rules and correspondence between nomenclatures.
To visualize priority areas for the LULUCF monitoring and mitigation actions, various environmental geospatial products are available from national, European or international products. In this case study, we present Italy’s national portal that displays such maps.
Agricultural use of organic soils contributes substantially to GHG emissions from organic soils. The Austrian Environment Agency addresses these questions in a project aiming to improve the estimates of drained organic soils in the Austrian National GHG Inventory
Ireland has experienced a fast evolution of methodology of the reporting of GHGs from grassland and wetlands that was influenced by a close collaboration between the communities of GHG reporting and research. A basis for this is the involvement of GHG inventory staff members in research projects as discussed by this case study.
Iceland still lacks country specific data for applying higher tier methodologies and approaches, especially for grasslands, croplands and wetlands. A case study presents how the country established an “improvement group” for advancing GHG reporting.
Moving to higher tiers often requires moving from default emissions factors and parameters, using more relevant values from national or regional studies. This case study presents how a regional project covering European Mediterranean countries developed information on carbon stocks and fluxes for living biomass in cropland and grasslands to improve the LULUCF monitoring in this region with specific ecological conditions.
Croatia needed to develop a geographically-explicit approach for land monitoring. This case study presents a LIFE-funded project that is aimed at creating such approach, using different earth observation products. The creation of a national land-use change timeseries has many policy implications for Croatia.