Portugal has developed its own land use and land-use change map that is a good example of a geographically-explicit approach to monitoring areas for the LULUCF inventory with a temporal consistency. This case study also presents Portugal’s method to cover past periods.
Overview
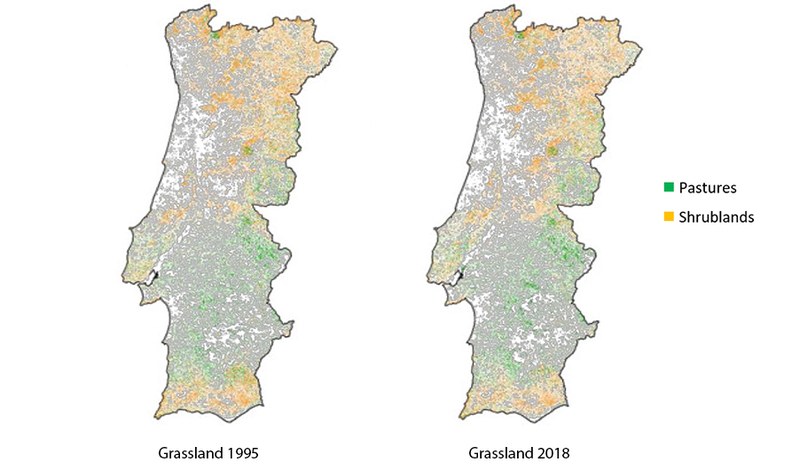
Portugal is one of the first Member States to use maps for monitoring land use changes in its national GHG inventory. Before 2014, Corine land cover maps were used but since the 2014 submission Portugal has been using data from the national Land-Use Cartography made available from the Direcção Geral do Território. The end of the first commitment period of the Kyoto Protocol coincided with this change and can be linked to the focus made at that time on the monitoring of afforestation and deforestation. Currently, Portugal uses its national product, called Cartografia de Ocupação de Solo, which was last updated in 2018 and now includes maps for the years 1995, 2007, 2010, 2015 and 2018, and uses a consistent nomenclature over time.
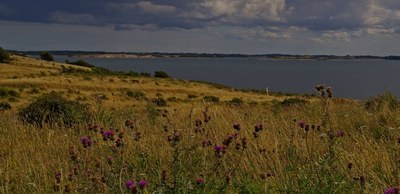
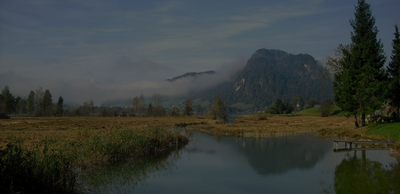
Figure 1: A consistent dataset for grassland mapping, with two editions allowing to detect land use changes.
Source: Portugal, National Inventory Report 202327, LULUCF Chapter.
By using these maps, Portugal manages the monitoring of 21 accurate categories of land uses. This categorization fits well with both national profiles of land uses and commonly accepted land use categories.
The period since 1995 is fully spatially-explicit while the precedent period is based on more basic data on land uses.
Total land-use changes were compiled for the periods 1995-2007, 2007-2010, 2010-2015 and 2015-2018 by overlapping the respective land-use maps.
The results were then annualized by dividing the area that changed by the number of years between maps (respectively 12, 3, 5 and 3 years).
Comparisons with older cartographic products have been made to correct improbable land use changes. This shows that quality control is needed and should be implemented to ensure the quality of spatially explicit products.
Temporal coverage
To cover the times series between 1970 and 1995, Portugal has put in place a series of procedures allowing to complete the periods that are not covered by the cartographic products.
Different information sources are used:
For forestlands, the main sources are the National Forest Inventories (1974, 1985, 1995).
For croplands, the main sources are the General Census of Agriculture (1979, 1989, 1999).
Spatial coverage
For Portugal, there is also the challenge of covering the different parts of its territory as this includes the Azores and Madeira. For these territories, the main sources of information are:
For these territories, the main sources of information are:
IFRAA (2007) – Regional Forest Inventory of the Autonomous Region of Azores
IFRAM (2004, 2010) – Regional Forest Inventory of the Autonomous Region of Madeira
RGA (1989, 1999, 2009) – General Census of Agriculture
The basis for the estimation of land use and land-use change in the Azores and Madeira was Corine Land Cover but the disaggregation into the 21 strata was made based on the other sources. Thus, a large set of products was used to complete the exhaustive inventory for the entire period and the entire territory.
Iceland still lacks country specific data for applying higher tier methodologies and approaches, especially for grasslands, croplands and wetlands. A case study presents how the country established an “improvement group” for advancing GHG reporting.
Moving to higher tiers often requires moving from default emissions factors and parameters, using more relevant values from national or regional studies. This case study presents how a regional project covering European Mediterranean countries developed information on carbon stocks and fluxes for living biomass in cropland and grasslands to improve the LULUCF monitoring in this region with specific ecological conditions.
Croatia needed to develop a geographically-explicit approach for land monitoring. This case study presents a LIFE-funded project that is aimed at creating such approach, using different earth observation products. The creation of a national land-use change timeseries has many policy implications for Croatia.
According to UNFCCC rules, LULUCF reporting from grassland and cropland should include the impact of trees and other woody vegetation . Trees on agricultural land in the EU have significant biomass production, which is not consistently recorded in the GHG inventories of Member States. Nor are Trees outside forests consistently reported in the GHG inventories of Member States.
Environmental policies are often based on a benchmark: maximum level of pollution allowed threshold above which further action is subsidized, etc. Improving the local relevance of the benchmark increases the cost-efficiency of a policy. Denmark has already applied this rationale to two environmental policies: peatland rewetting and nitrogen limits.
Like many countries, Canada was confronted with the challenges of timely reporting and the combining of multiple datasets for estimating forest emissions and removals. To address these challenges, Canada developed the Carbon Budget Model of the Canadian Forest Sector (CBM-CFS3) . It is a complex Tier 3 model that can be used for other purposes and by other stakeholders (e.g. projections, harvest strategy, fire prevention).
As many countries, France has an efficient forest inventory which provides accurate estimates of tree growth, harvest and mortality. The associated drawback is a coarse time resolution which hinders appropriation of the reported data by policy makers. To bridge this gap, a simple model combining 5-yearly forest inventory data with annual statistics was developed , allowing meaningful annual estimates which, among others, reflect dramatic events such as storms in the time series.
Over the past few years in France, farmers have received incentives to define the GHG budget of their farm and identify climate mitigation levers through numerous channels. However, the synergies with the national GHG inventory and public policies are still underexploited.
A discrepancy of 500,000 ha in forest area in Romania was found when comparing national legal forest maps and National Forest Inventory information. This case study describes how Romania has set up a multi-data integration system to more accurately assess time series of forest cover dynamics.
This case study presents how France implemented a new geographically-explicit method to move from Approach 2 to Approach 3 for land representation. This method combines several national and European datasets within a high-resolution grid, using hierarchy rules and correspondence between nomenclatures.
To visualize priority areas for the LULUCF monitoring and mitigation actions, various environmental geospatial products are available from national, European or international products. In this case study, we present Italy’s national portal that displays such maps.
Agricultural use of organic soils contributes substantially to GHG emissions from organic soils. The Austrian Environment Agency addresses these questions in a project aiming to improve the estimates of drained organic soils in the Austrian National GHG Inventory
Ireland has experienced a fast evolution of methodology of the reporting of GHGs from grassland and wetlands that was influenced by a close collaboration between the communities of GHG reporting and research. A basis for this is the involvement of GHG inventory staff members in research projects as discussed by this case study.
Iceland still lacks country specific data for applying higher tier methodologies and approaches, especially for grasslands, croplands and wetlands. A case study presents how the country established an “improvement group” for advancing GHG reporting.
Moving to higher tiers often requires moving from default emissions factors and parameters, using more relevant values from national or regional studies. This case study presents how a regional project covering European Mediterranean countries developed information on carbon stocks and fluxes for living biomass in cropland and grasslands to improve the LULUCF monitoring in this region with specific ecological conditions.
Croatia needed to develop a geographically-explicit approach for land monitoring. This case study presents a LIFE-funded project that is aimed at creating such approach, using different earth observation products. The creation of a national land-use change timeseries has many policy implications for Croatia.