All official European Union website addresses are in the europa.eu domain.
See all EU institutions and bodies
An official website of the European Union | How do you know?
Environmental information systems
EN


EEA report 08/2025
This report explores the historical trends, most recent progress and projected future developments in climate change mitigation through reduced greenhouse gas emissions, renewable energy gains and improved energy efficiency. It builds upon data reported by all 27 European Union (EU) Member States, five European Environment Agency (EEA) member countries and nine Energy Community contracting parties.
A technical background document accompanies this report, providing further detail on the data sources and targets referenced throughout.
EN PDF: TH-01-25-028-EN-N - ISBN: 978-92-9480-734-2 - ISSN: 1977-8449 - doi: 10.2800/6474400
Related reports
Updated climate and energy indicators
- Total net greenhouse gas emission trends and projections in Europe
- Progress towards national greenhouse gas emissions targets in Europe
- Greenhouse gas emissions under the EU Emissions Trading System
- Greenhouse gas emissions from land use, land use change and forestry in Europe
- Greenhouse gas emissions from agriculture in Europe
- Greenhouse gas emissions from energy use in buildings in Europe
- Greenhouse gas emission intensity of electricity generation in Europe
- Primary and final energy consumption in Europe
- Share of energy consumption from renewable sources in Europe
- Greenhouse gas emissions from transport in Europe
- Use of renewable energy for transport in Europe
- New registrations of electric cars in Europe
- Greenhouse gas emission intensity of fuels and biofuels for road transport in Europe
Datasets
- Preliminary dataset on EU greenhouse gas emissions
- Preliminary dataset on EU renewable energy shares
- Preliminary dataset on EU energy efficiency
- Dataset on national greenhouse gas emissions projections
- Greenhouse gas emissions under the Effort Sharing Legislation
- National systems for policies and measures and greenhouse gas projections
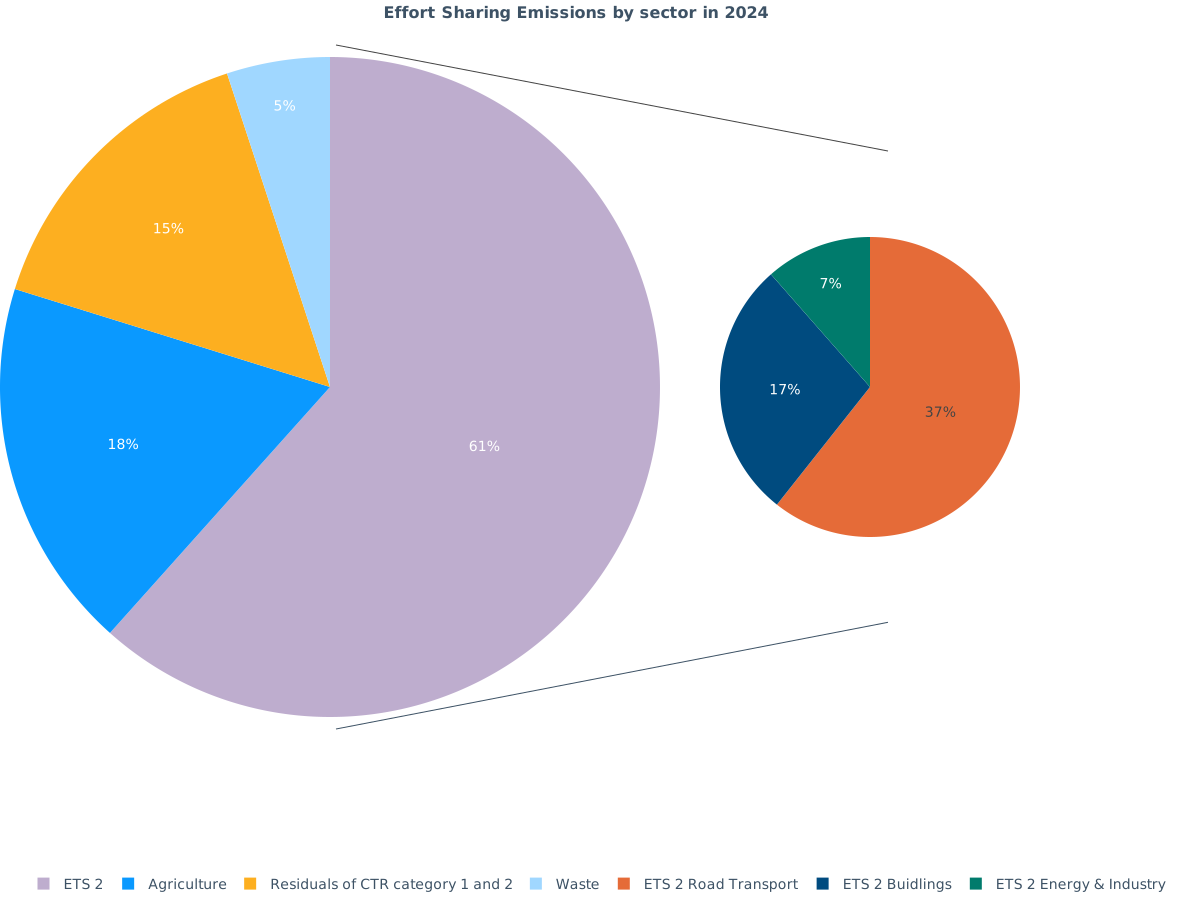
ETS2 and ESR emissions EU-level in 2024
This figure shows the breakdown of EU emissions under the Effort Sharing Regulation (ESR) by sector, highlighting relative shares and coverage under the ETS2. Data refer to 2024.
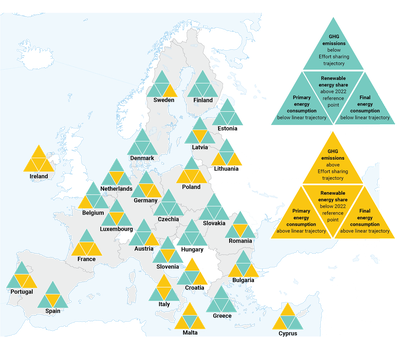
Member States climate and energy progress in 2023
This figure illustrates the 2023 climate and energy performance of Member States. For the GHG emissions dimension, it compares 2023 GHG emissions under the Effort Sharing Regulation with the available annual emission allocation (AEA) for 2023. This is a first step towards the assessment of 2023 progress, given that Member States have flexibilities under the Effort Sharing Regulation to match the AEA with its emissions. For primary and final energy consumption, it compares the national energy consumption in 2023 with a 2023 trajectory value based on a linear trajectory between the 2020 national target and the 2030 national contribution as included in the National Energy and Climate Plan submitted in 2024. For Renewable Energy it compares the 2023 renewable energy share with the interpolated value for the year 2023 between reference points under the Governance Regulation 2022 and 2025 as reported in National Energy and Climate Plans.
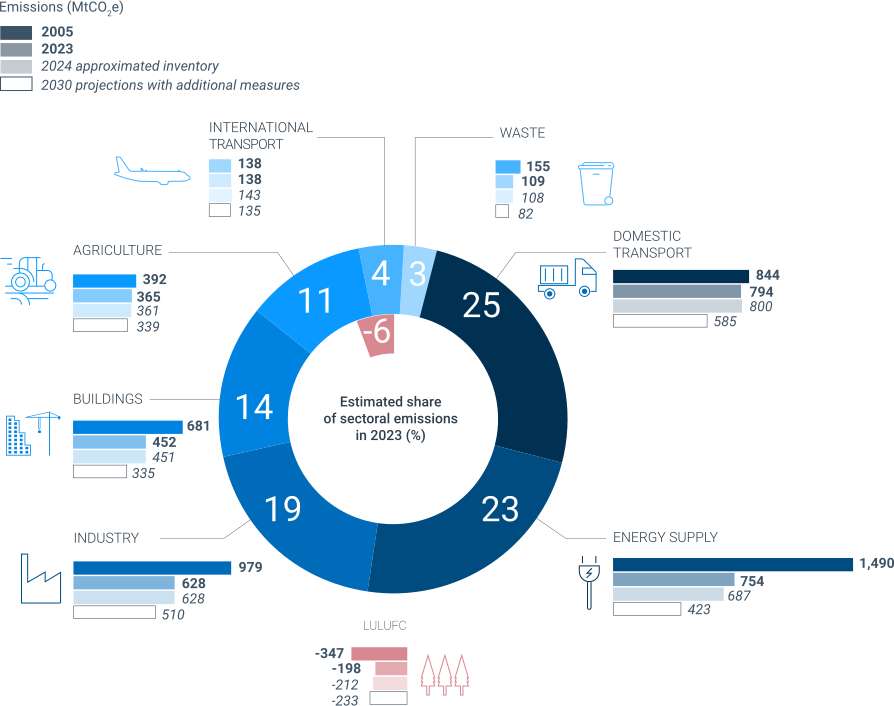
Sectoral trends and progress towards achieving the 2030 GHG emission target
This figure presents the GHG emissions per sector in the EU for 2005, 2023 and 2024, and the 2030 projected emissions including additional measures forecasted by Member States.
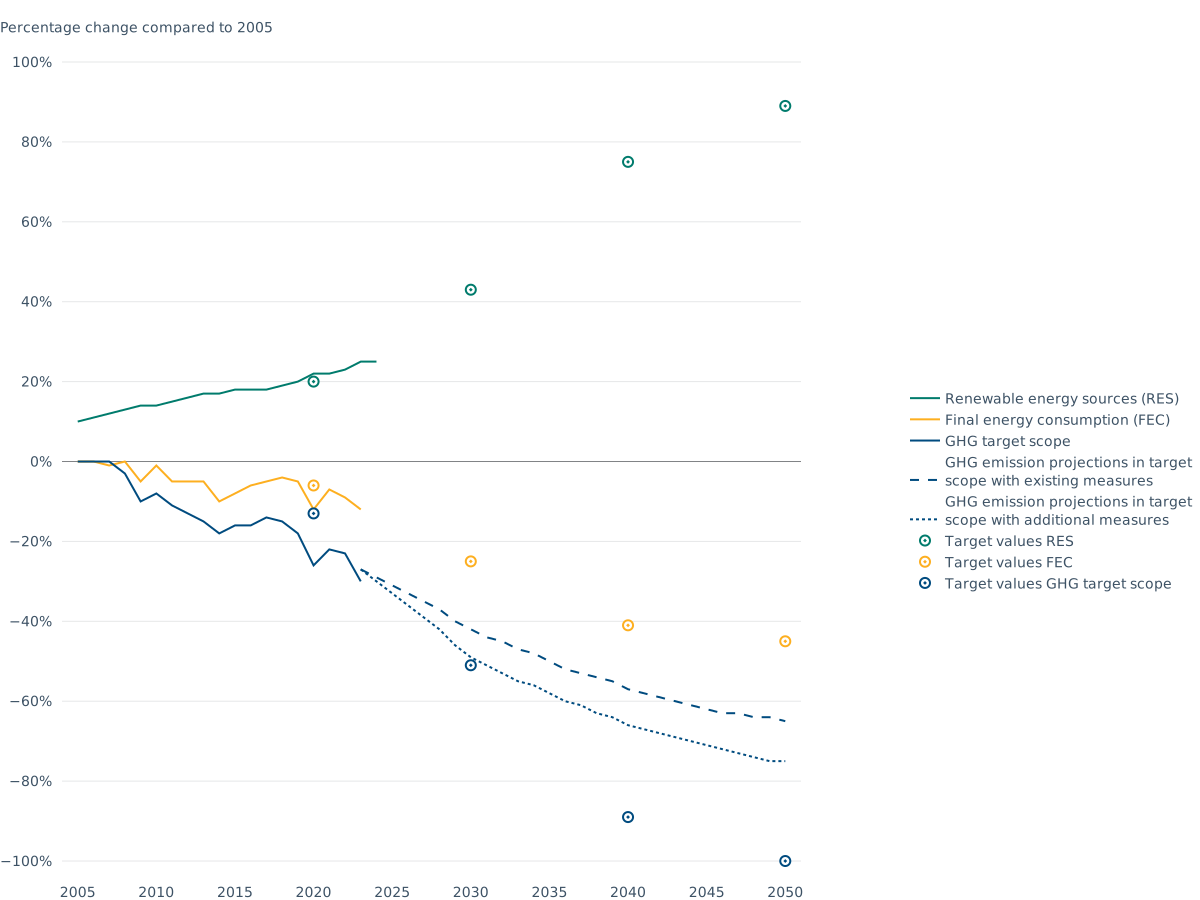
EU achievement of 2020 and progress towards 2030 and 2050 climate and energy targets
This figure shows EU progress since 2005 on reducing Greenhouse Gas (GHG) emissions, increasing the Renewable Energy Share (RES) and reducing Energy Consumption (EC). The EU’s total net GHG emissions include all emissions and removals regulated by EU law.
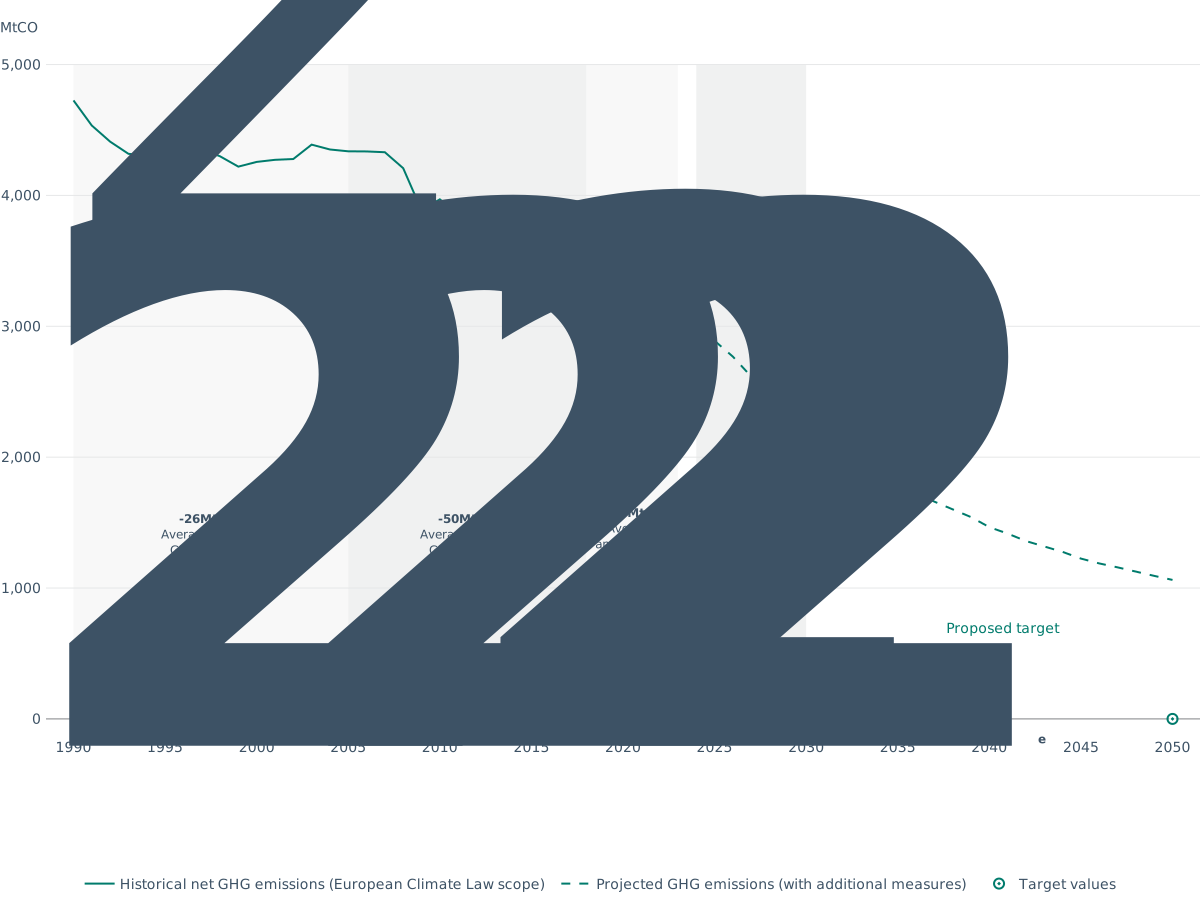
Total net GHG emissions in the EU (1990-2050)
The chart shows the evolution of EU net emissions over the past decades, displaying how the EU has reduced its Greenhouse Gas (GHG) emissions at an accelerating pace. These figures include domestic emissions, emissions and removals from the LULUCF sector and emissions from international aviation and international maritime transport, as covered under EU regulations.
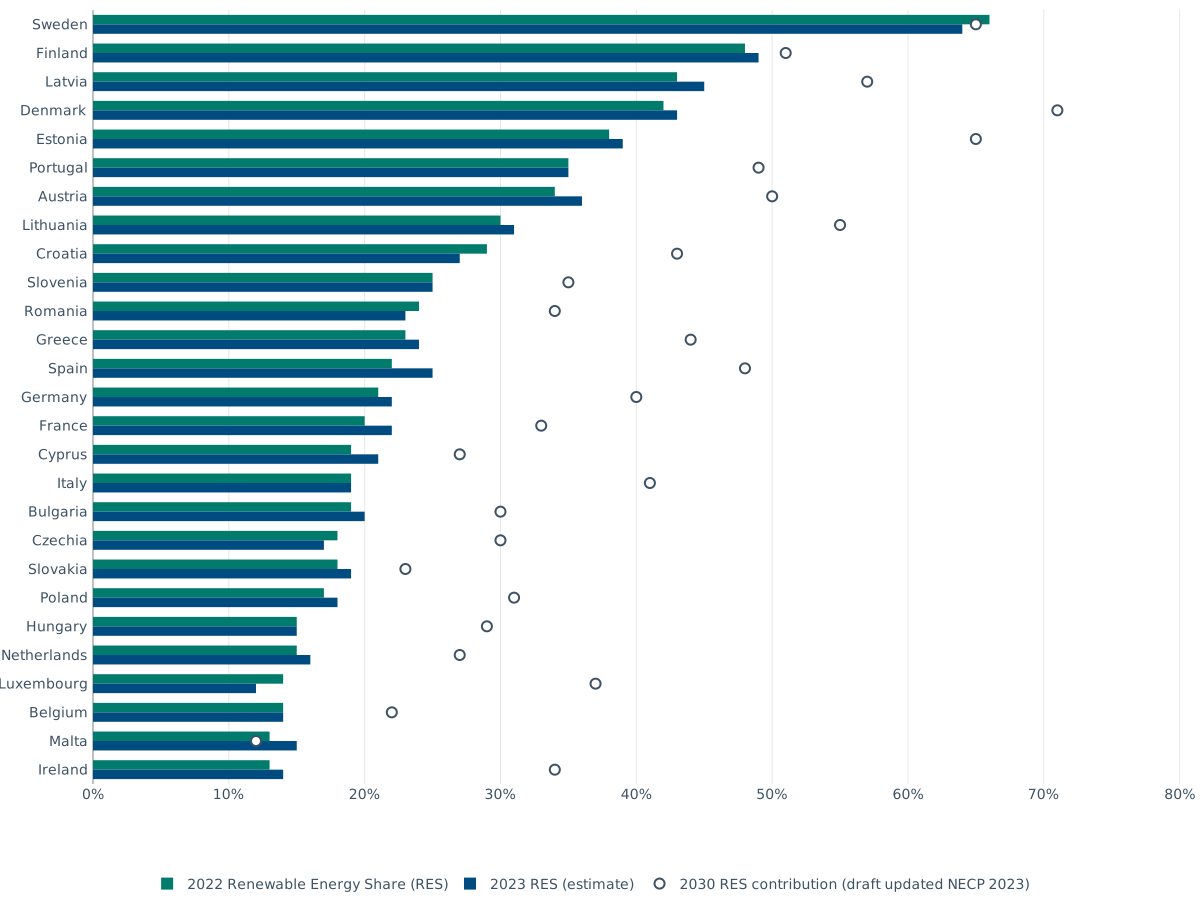
Renewable energy shares of EU Member States and their current 2030 national contributions
This figure depicts the Renewable Energy Shares per Member State for 2022 and 2023, incorporating the 2030 contributions outlined in their respective 2023 National Energy and Climate Plans.The data for 2022 rely on Eurostat (2024a), whereas the 2023 data points are based on approximated estimates for the share of gross final consumption of renewable energy sources by the EEA.