All official European Union website addresses are in the europa.eu domain.
See all EU institutions and bodies
An official website of the European Union | How do you know?
Environmental information systems
EN


EEA report 12/2026
This report explores the historical trends, most recent progress and projected future developments in climate change mitigation through reduced greenhouse gas (GHG) emissions, renewable energy gains and improved energy efficiency. It builds upon data reported by all 27 European Union (EU) Member States, five other European Environment Agency (EEA) member countries and nine Energy Community Contracting Parties.
A technical background document accompanies this report, providing further detail on the data sources and targets referenced throughout.
EN PDF: TH-01-26-042-EN-N - ISBN: 978-92-9480-794-6 - ISSN: 1977-8449 - doi: 10.2800/7752783
Related reports
Updated climate and energy indicators
- Total net greenhouse gas emission trends and projections in Europe
- Progress towards national greenhouse gas emissions targets in Europe
- Greenhouse gas emissions under the EU Emissions Trading System
- Greenhouse gas emissions from land use, land use change and forestry in Europe
- Greenhouse gas emissions from agriculture in Europe
- Greenhouse gas emissions from energy use in buildings in Europe
- Greenhouse gas emission intensity of electricity generation in Europe
- Primary and final energy consumption in Europe
- Share of energy consumption from renewable sources in Europe
- Greenhouse gas emissions from transport in Europe
- Use of renewable energy for transport in Europe
- Share of buses and trains in inland passenger transport in Europe
Datasets
- Preliminary dataset on EU greenhouse gas emissions
- Preliminary dataset on EU renewable energy shares
- Preliminary dataset on EU energy efficiency
- Dataset on national greenhouse gas emissions projections
- Greenhouse gas emissions under the Effort Sharing Legislation
- Integrated Climate and Energy Policies and Measures (PaMs)
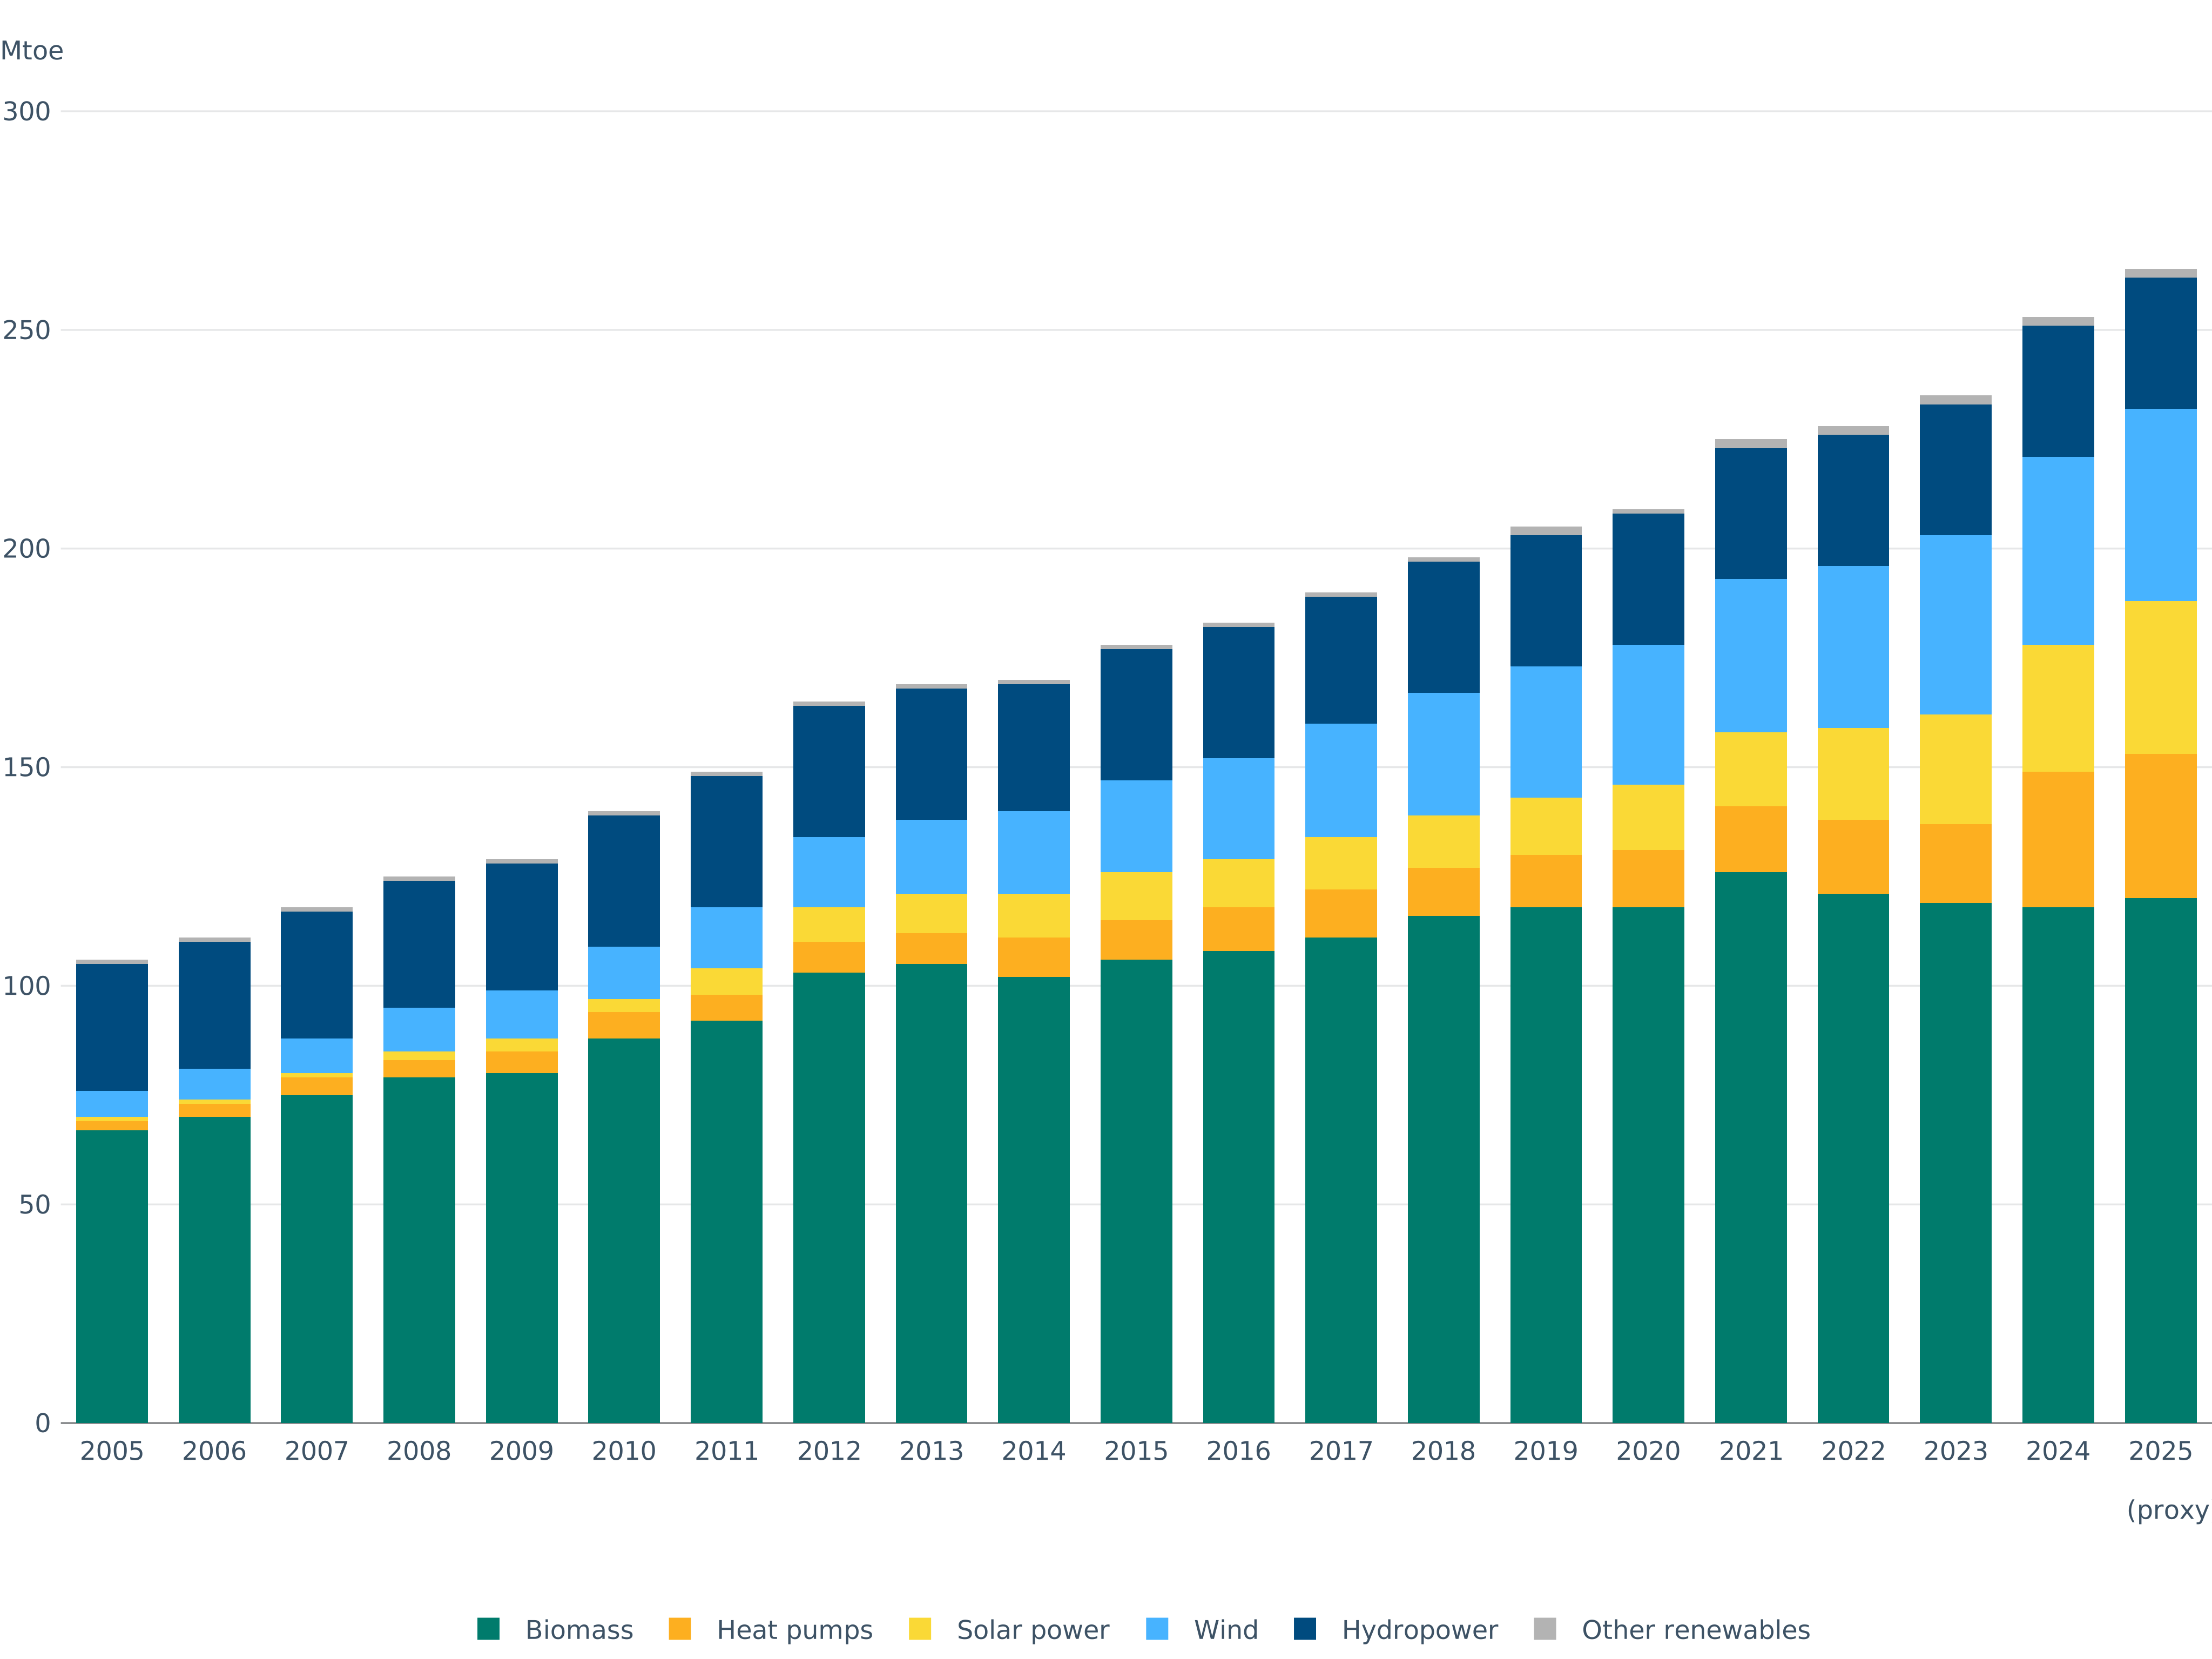
Renewable gross final energy consumption in the EU-27 by technology 2005-2025
This figure illustrates the renewable energy consumed in the EU 27 per technology. The category of biomass bundles solid biomass (inc. municipal waste), biodiesel, biogasoline, other biofuels (complying with RED sustainability criteria), biogas and bioliquids. Solar refers to concentrated solar power, solar photovoltaic and solar thermal. Hydropower covers normalized hydropower excl. pumping. Wind refers to normalized onshore and offshore wind. Heat pumps refer to renewable energy from heat pumps. Other renewables include tidal, wave and ocean energy and geothermal electricity.
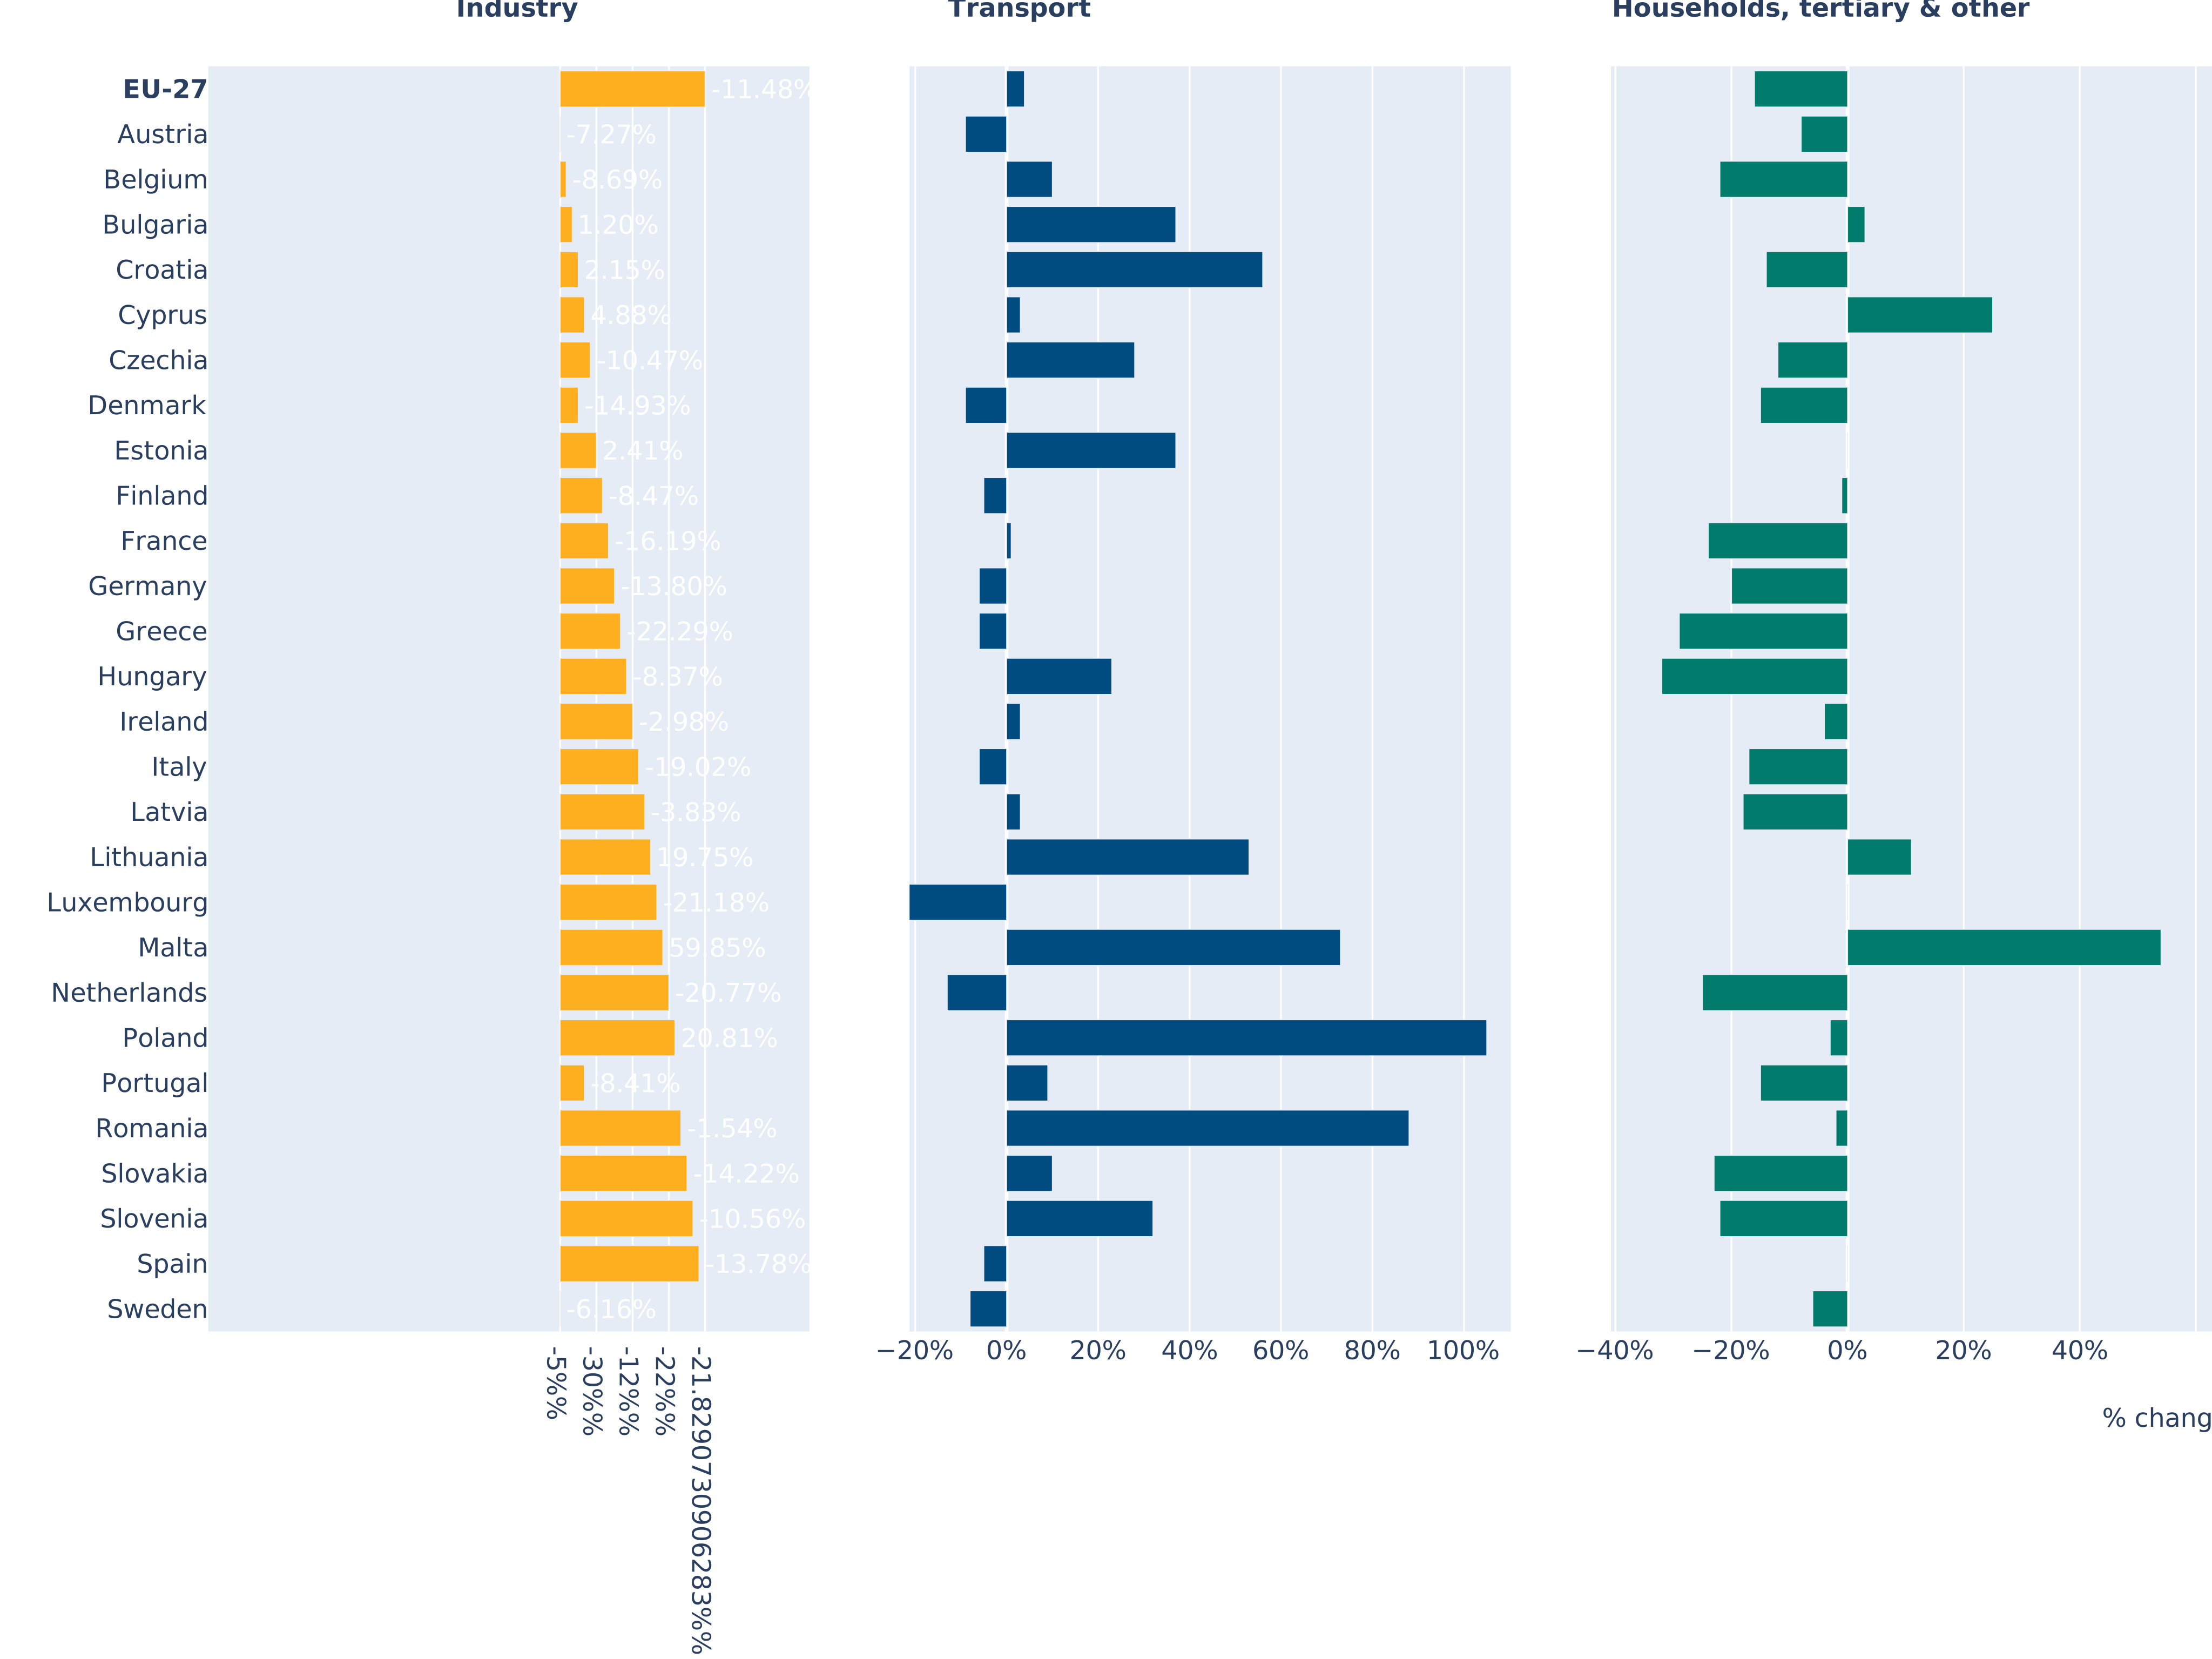
Sectoral final energy consumption changes in the EU-27 and Member States, between 2005 and 2024
This figure illustrates the 2005-2024 percentage changes in FEC in the EU-27 and Member States by end-sector. FEC is based on the definition laid out in Article 2 of the revised EED, including international aviation and excluding ambient energy. The sector ‘households, tertiary & other’ includes households, commercial and public services, agriculture and forestry, fishing and other sectors not elsewhere specified.
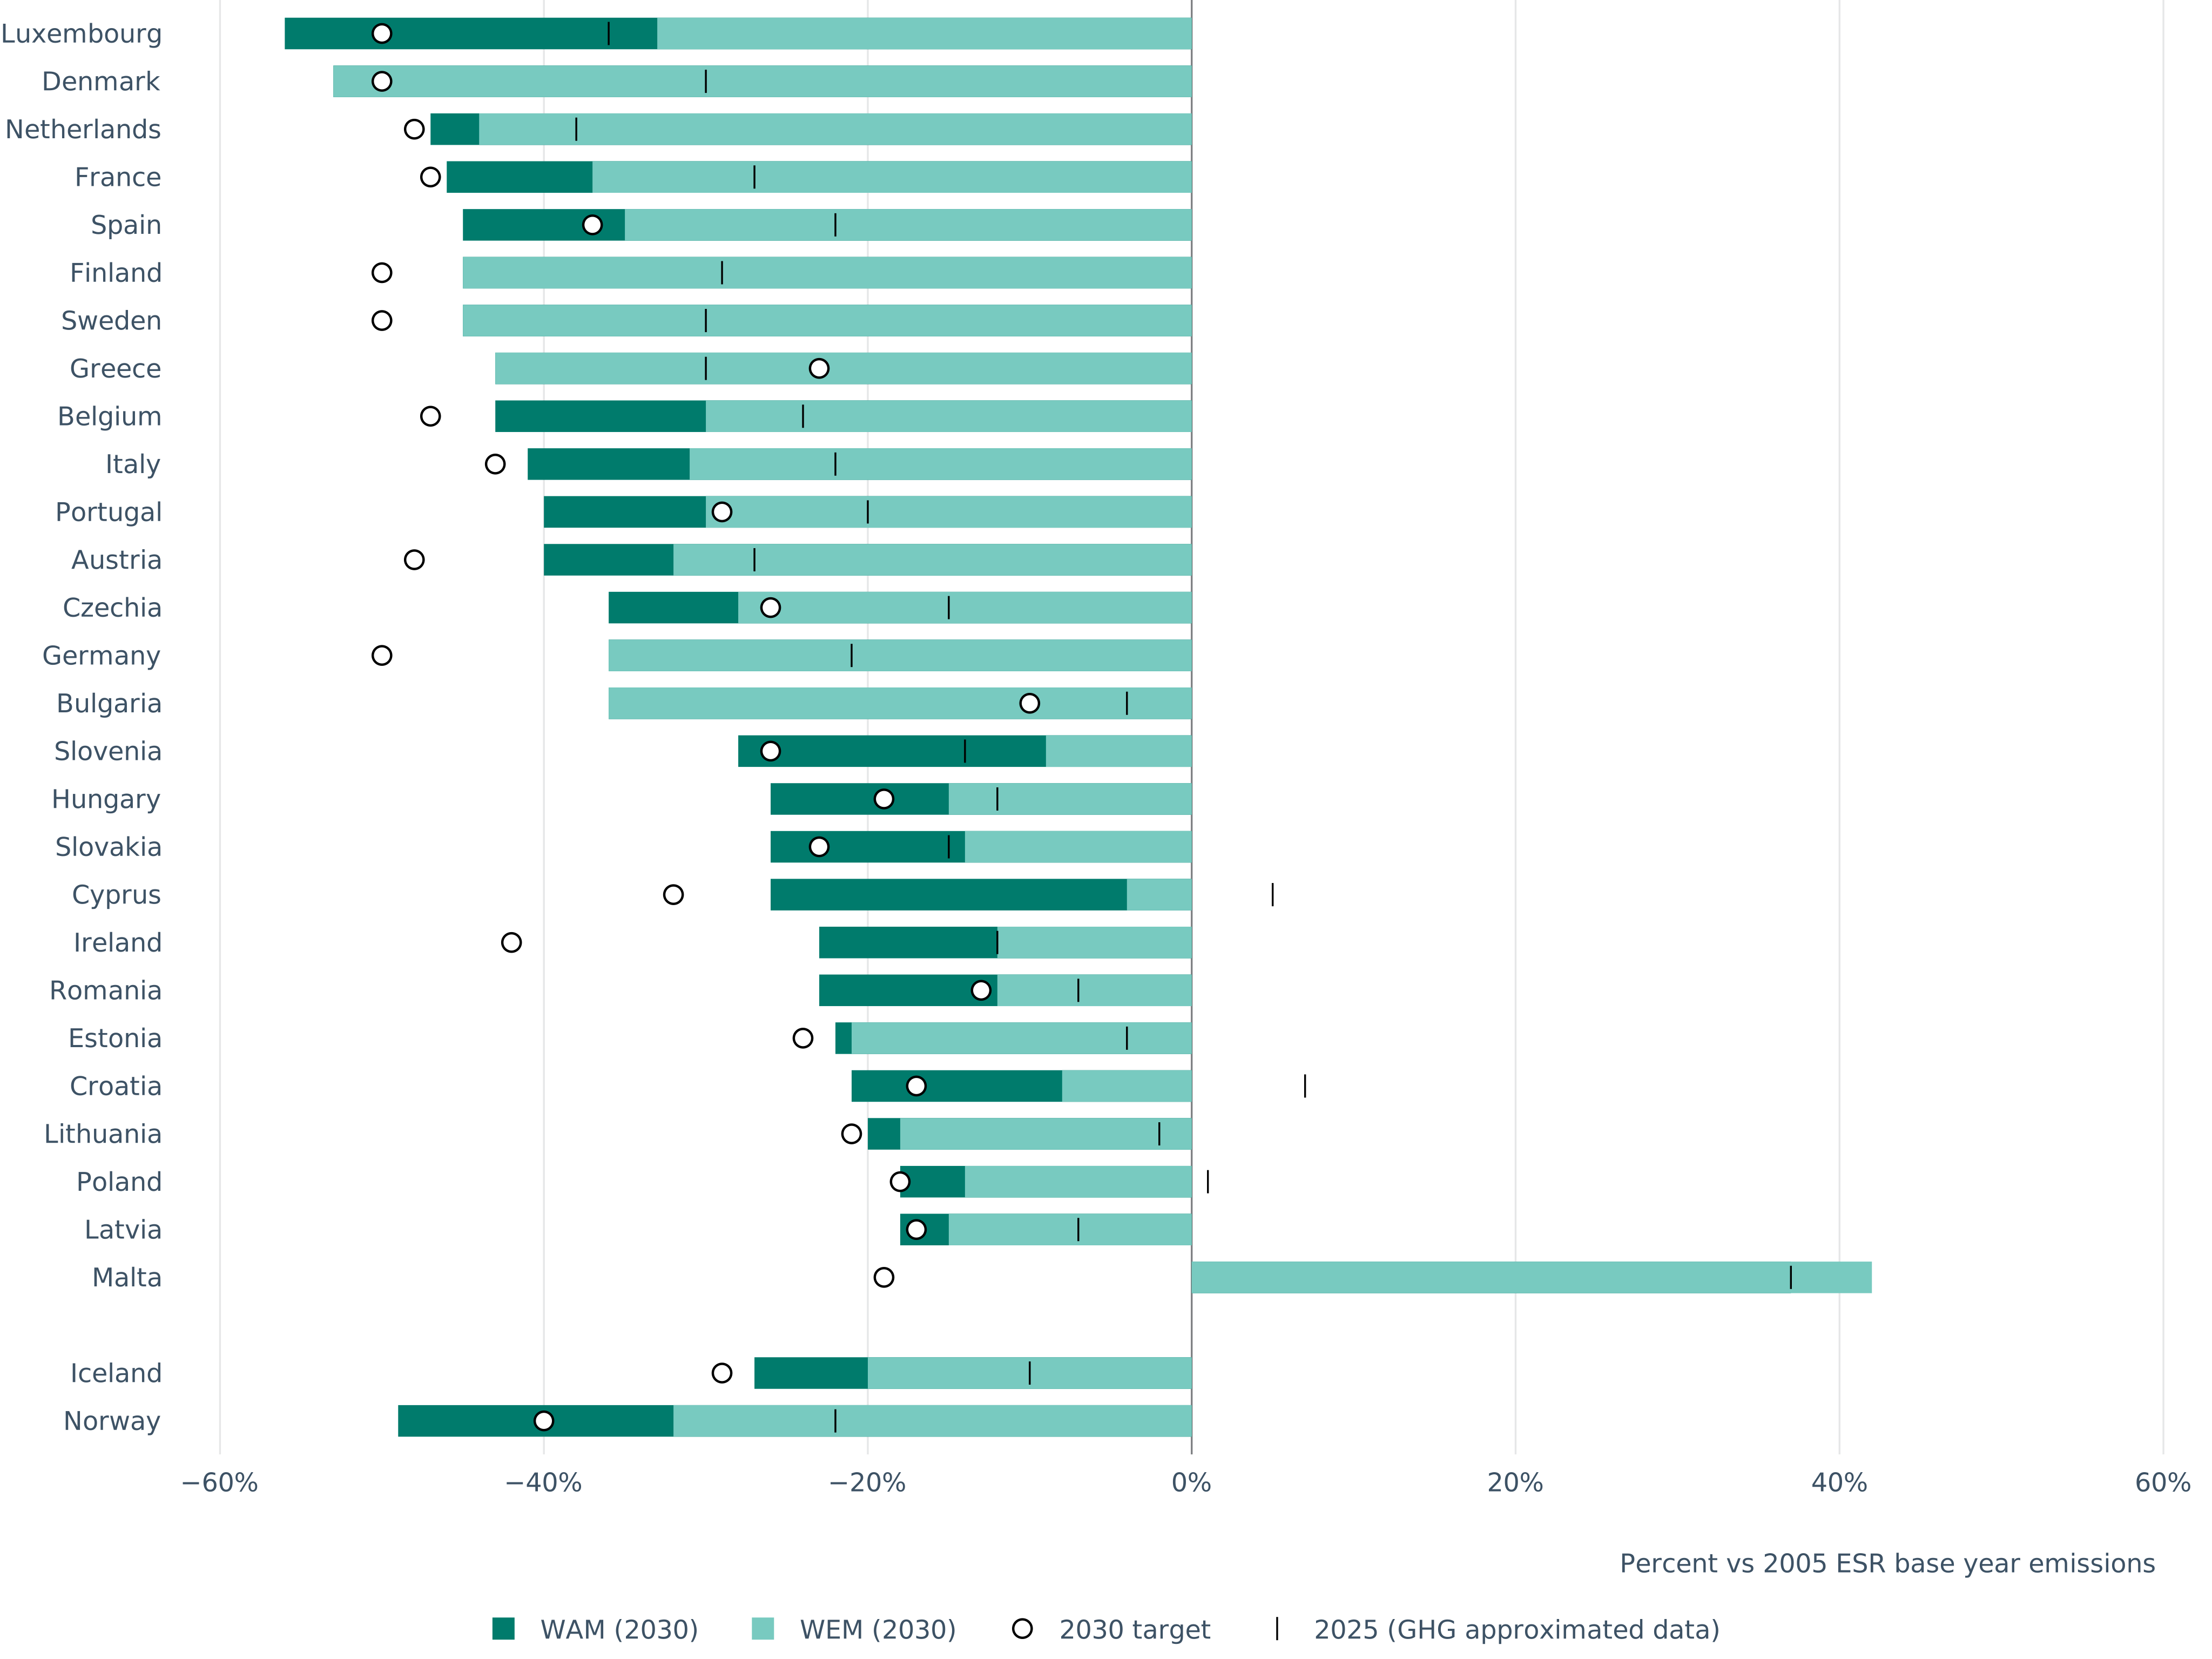
Estimated and projected emissions in the effort sharing sectors in 2025 and 2030 compared to Member States' national targets
The figure compares countries Effort Sharing emission targets with 2030 ESR projected emission levels and 2025 GHG approximated numbers. Projected emissions are displayed both as with only existing measures and with additional policies and measures.
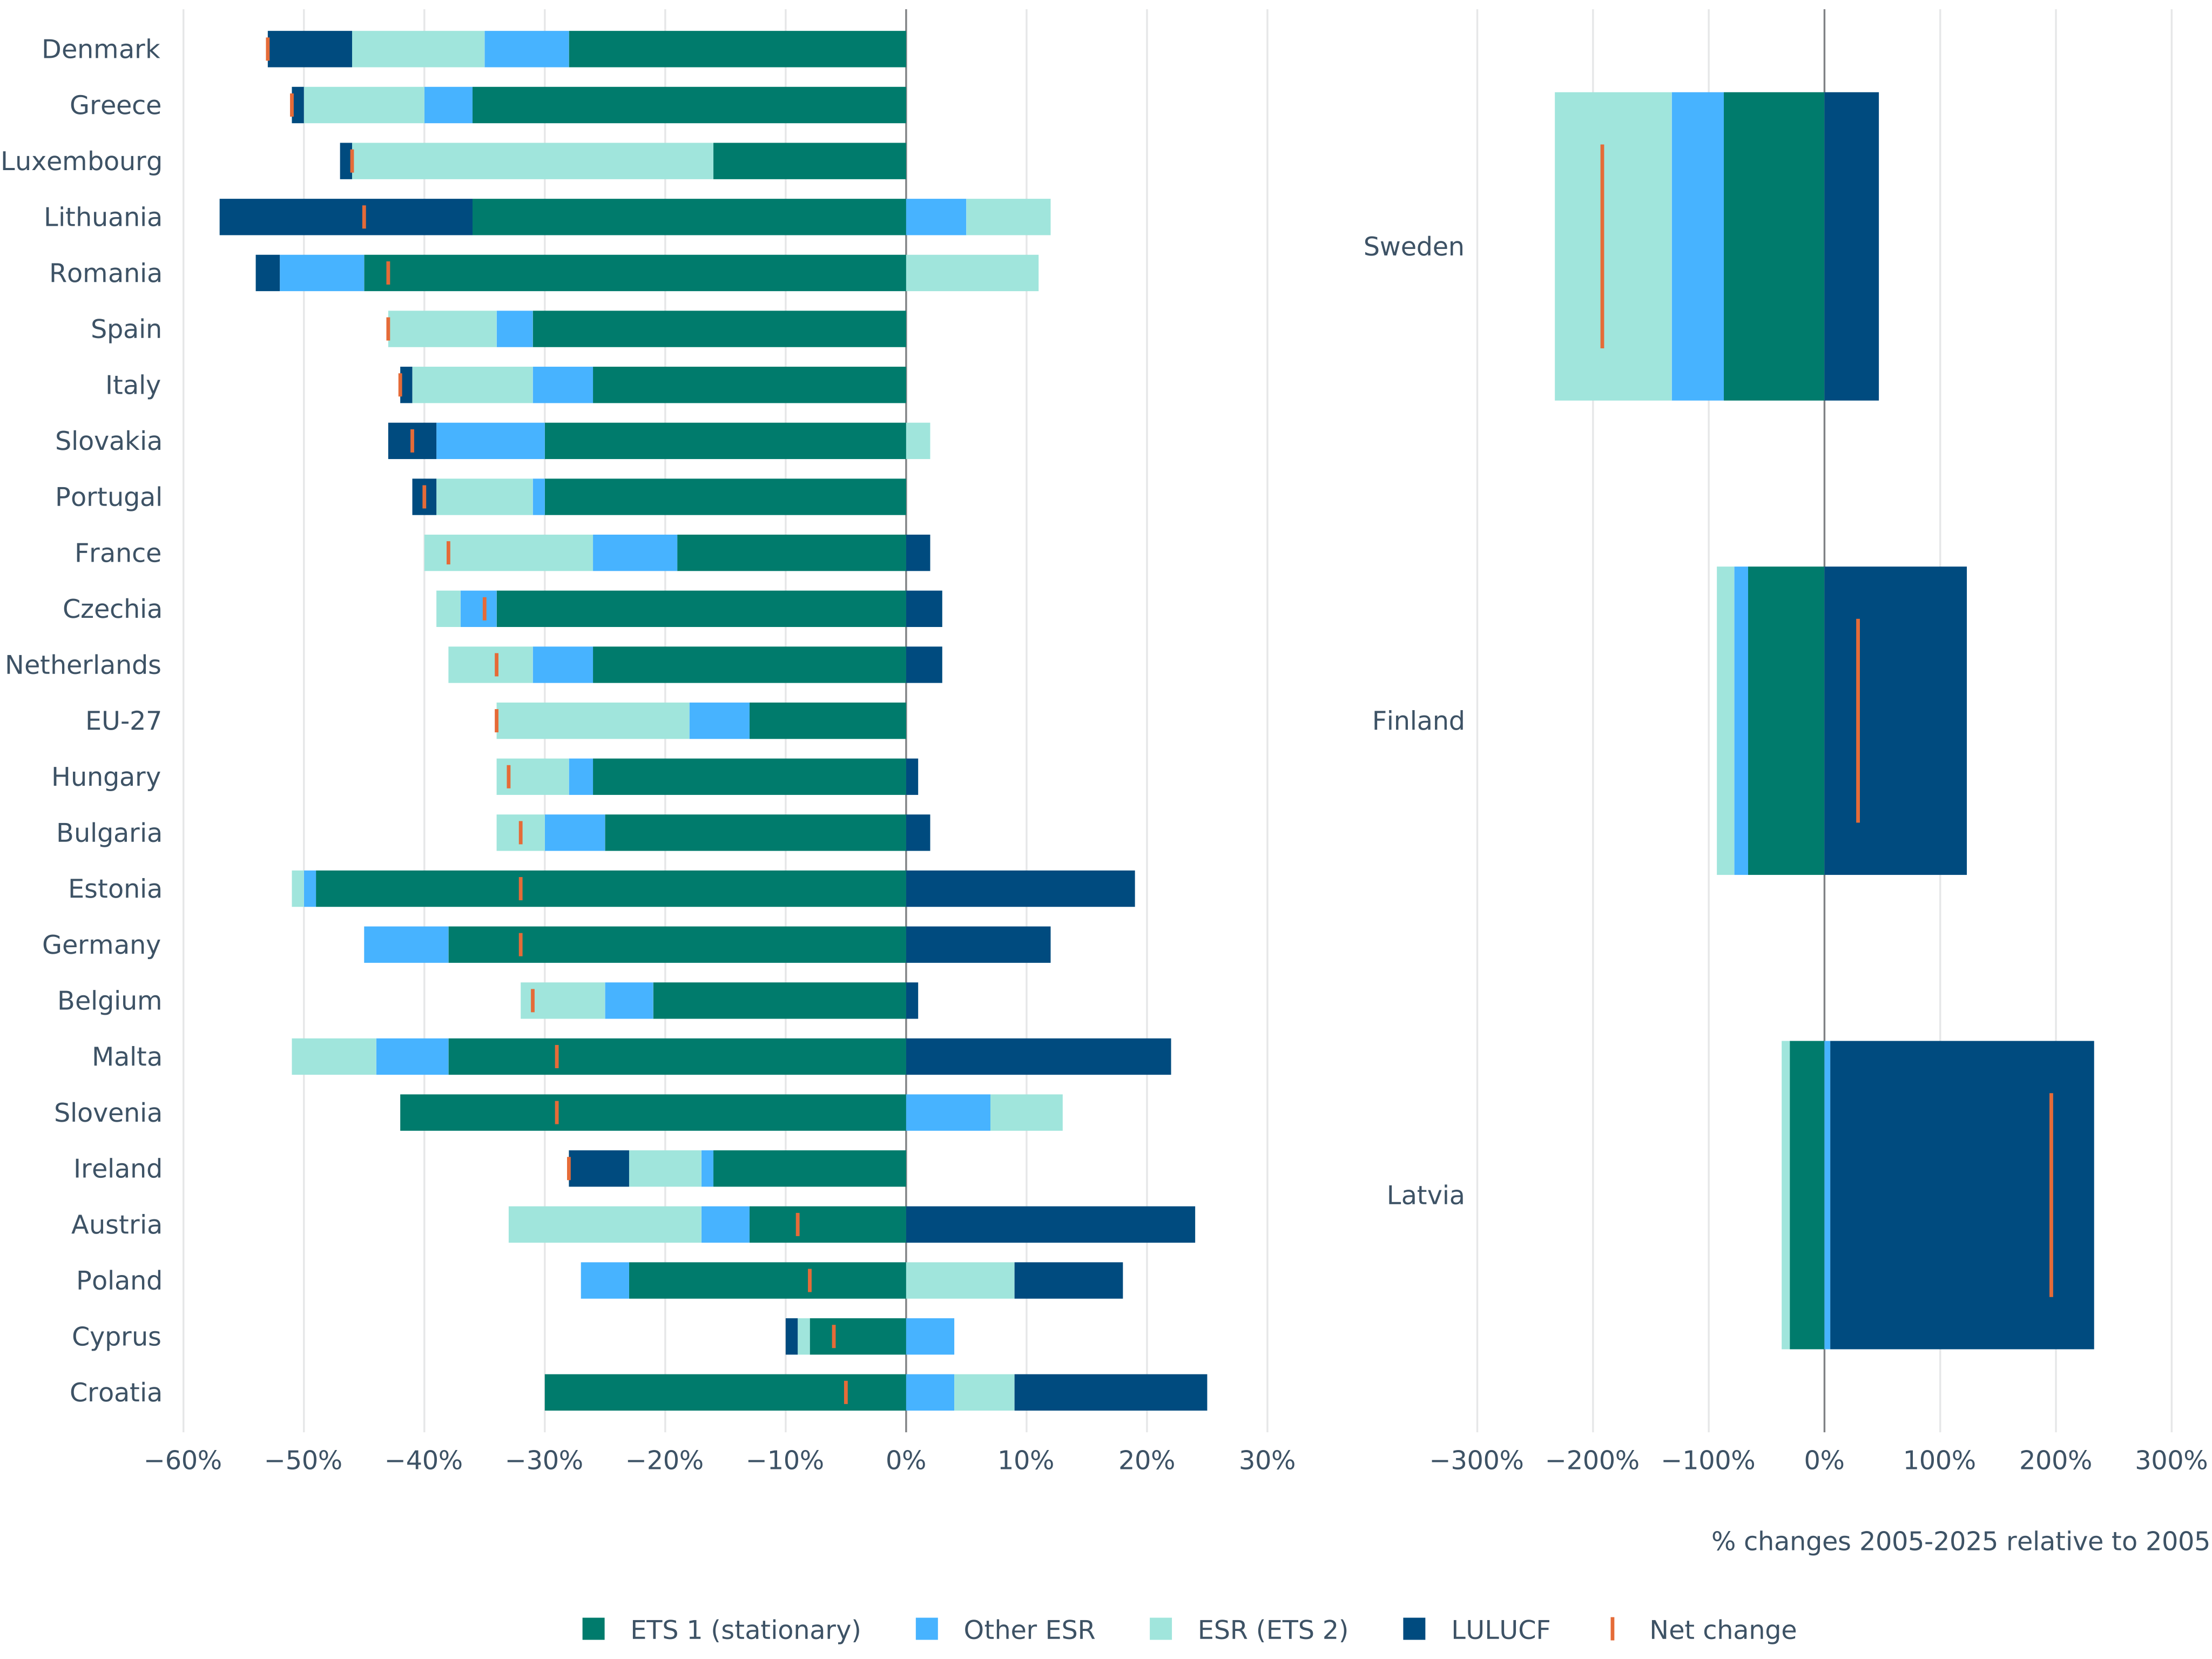
Evolution of ETS1 & 2 and ESR emissions and LULUCF removals and emissions by Member State
In this graph, absolute changes of the Emissions Trading System (ETS1) from stationary installations, the ETS2 and the remaining part of emissions under the Effort Sharing Regulation (ESR), and Land Use, Land-Use Change, and Forestry (LULUCF) are expressed as percentage changes relative to the total net Greenhouse Gas (GHG) emissions of 2005. In this way, the change in total net GHG emissions between 2005 and 2025 is broken down into changes of emissions covered under these policy instruments.
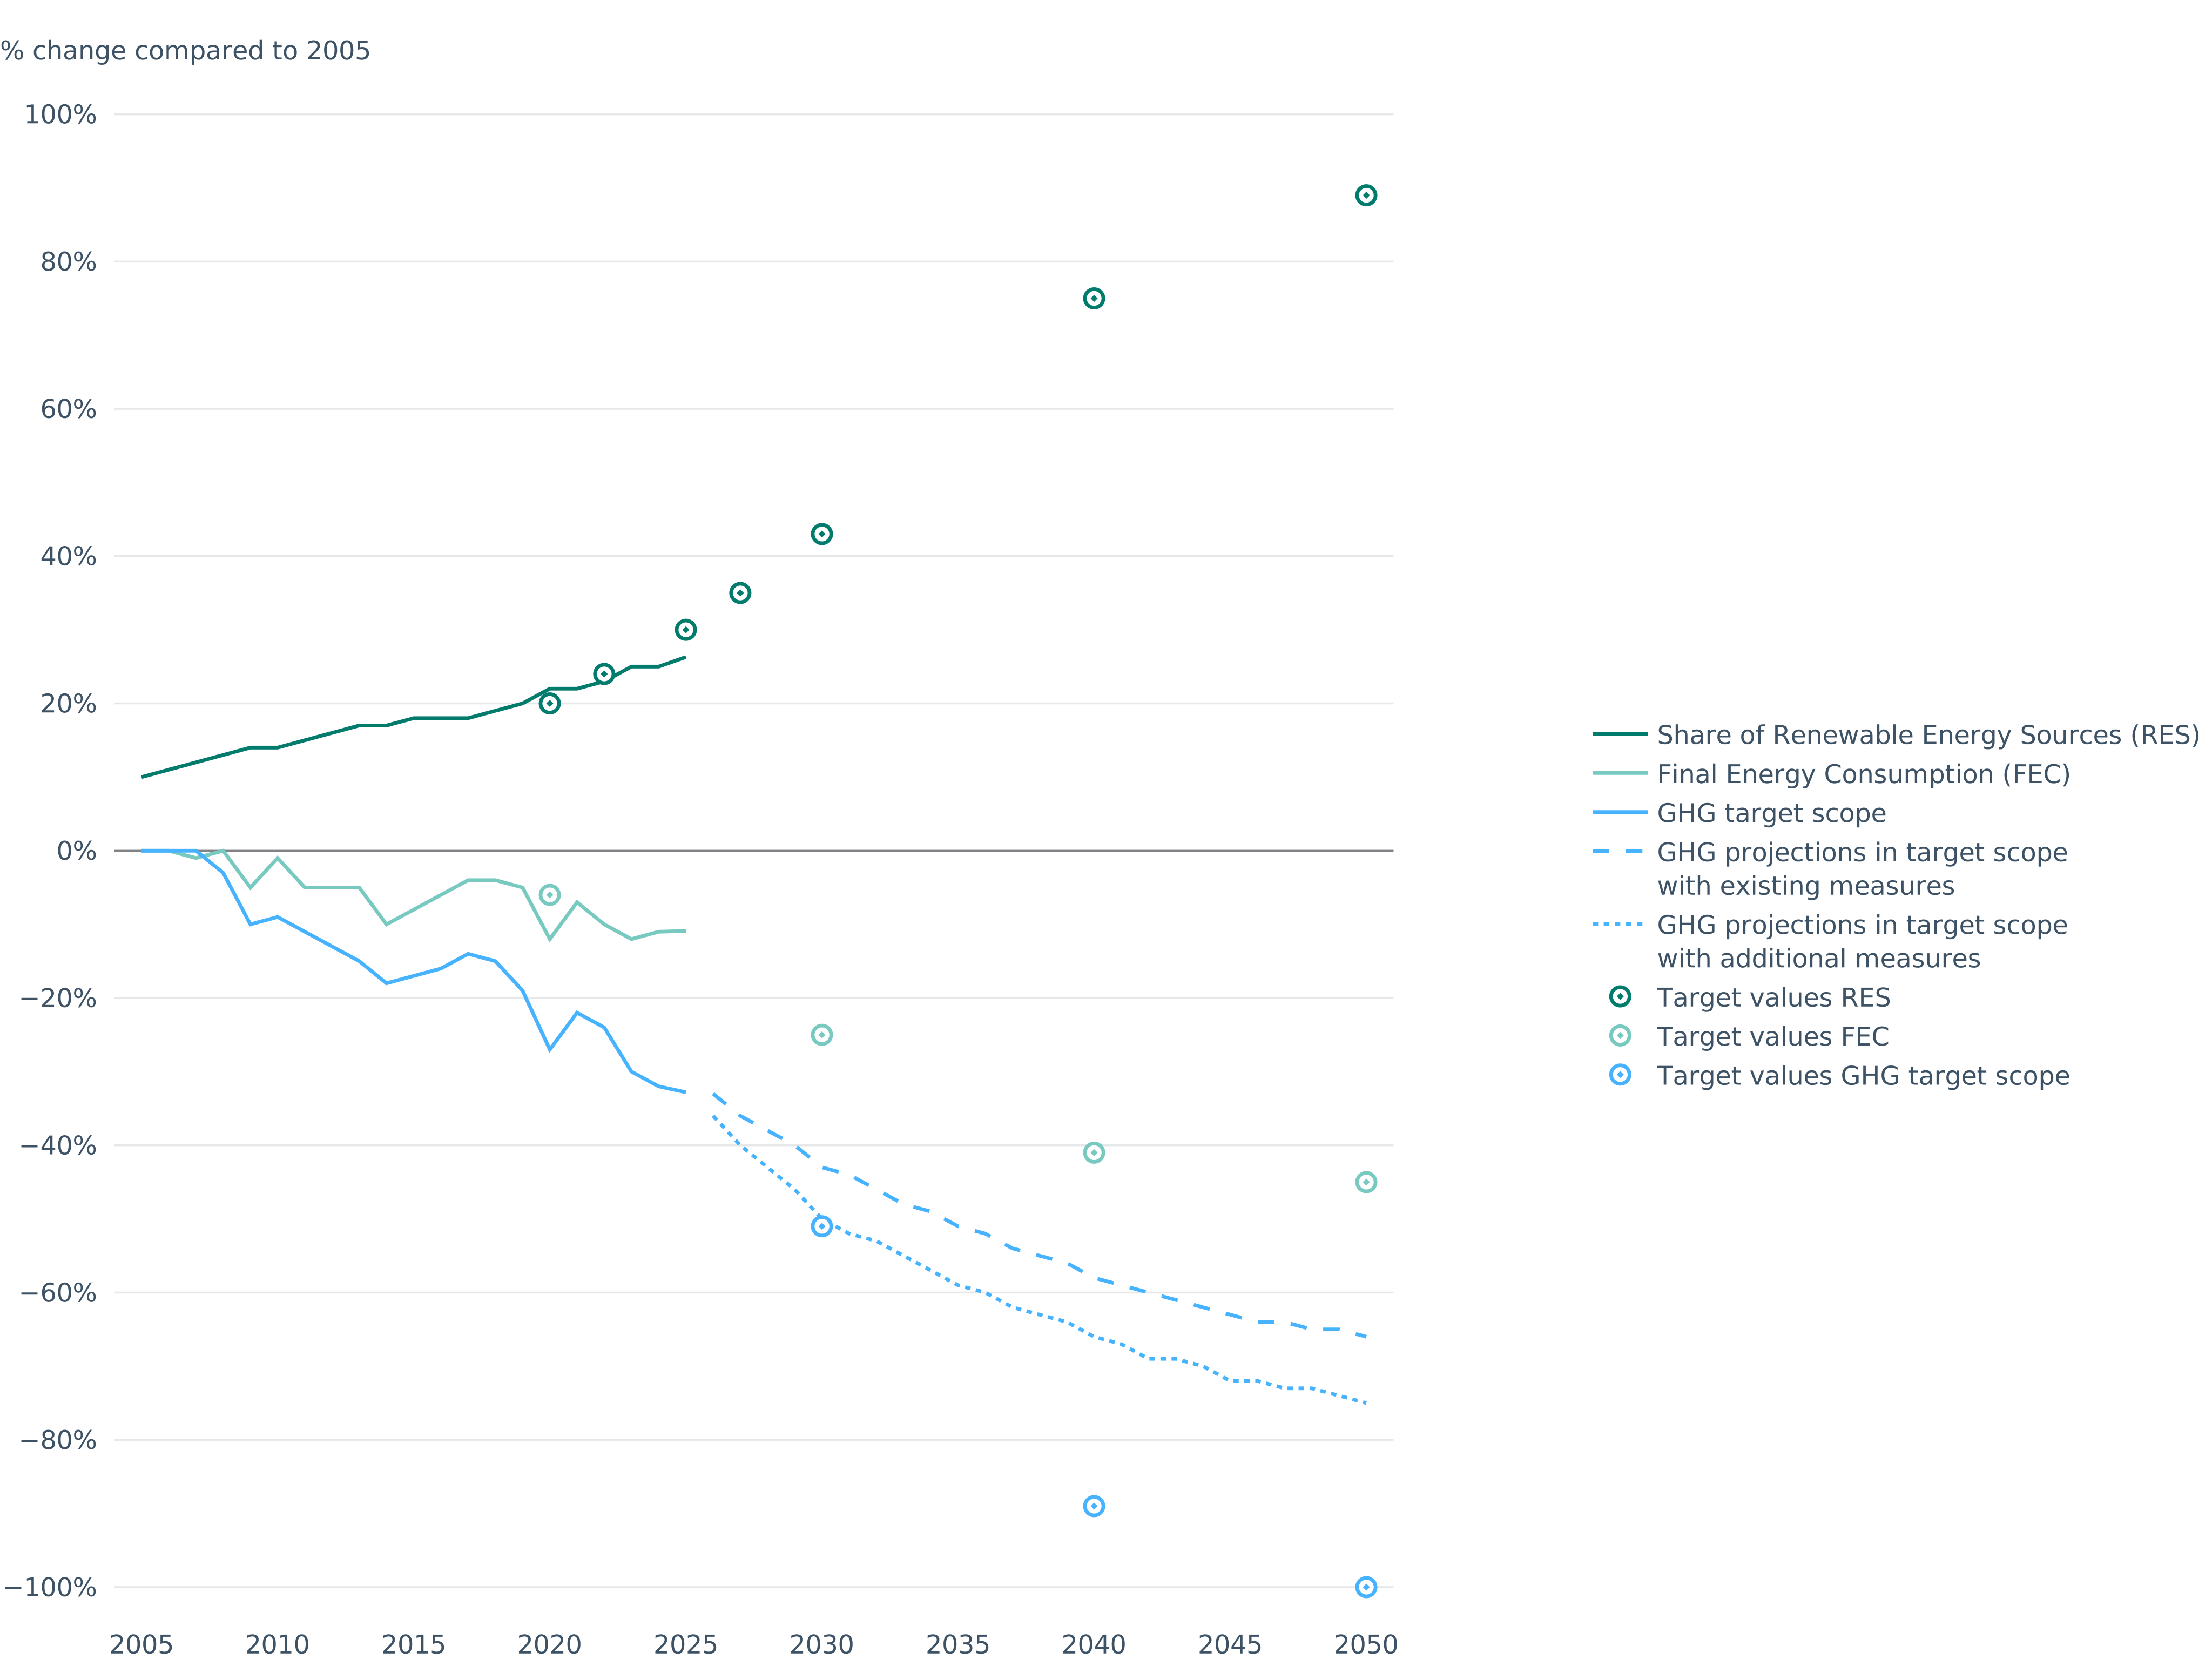
EU achievement of 2020 and progress towards 2030 and 2050 climate and energy targets
This figure presents the progress of the EU’s headline targets since 2005: reducing greenhouse gas emissions, increasing the renewable energy share and reducing energy consumption. In this figure, the EU total net greenhouse gas emissions include all GHG emissions and removals regulated by EU law.
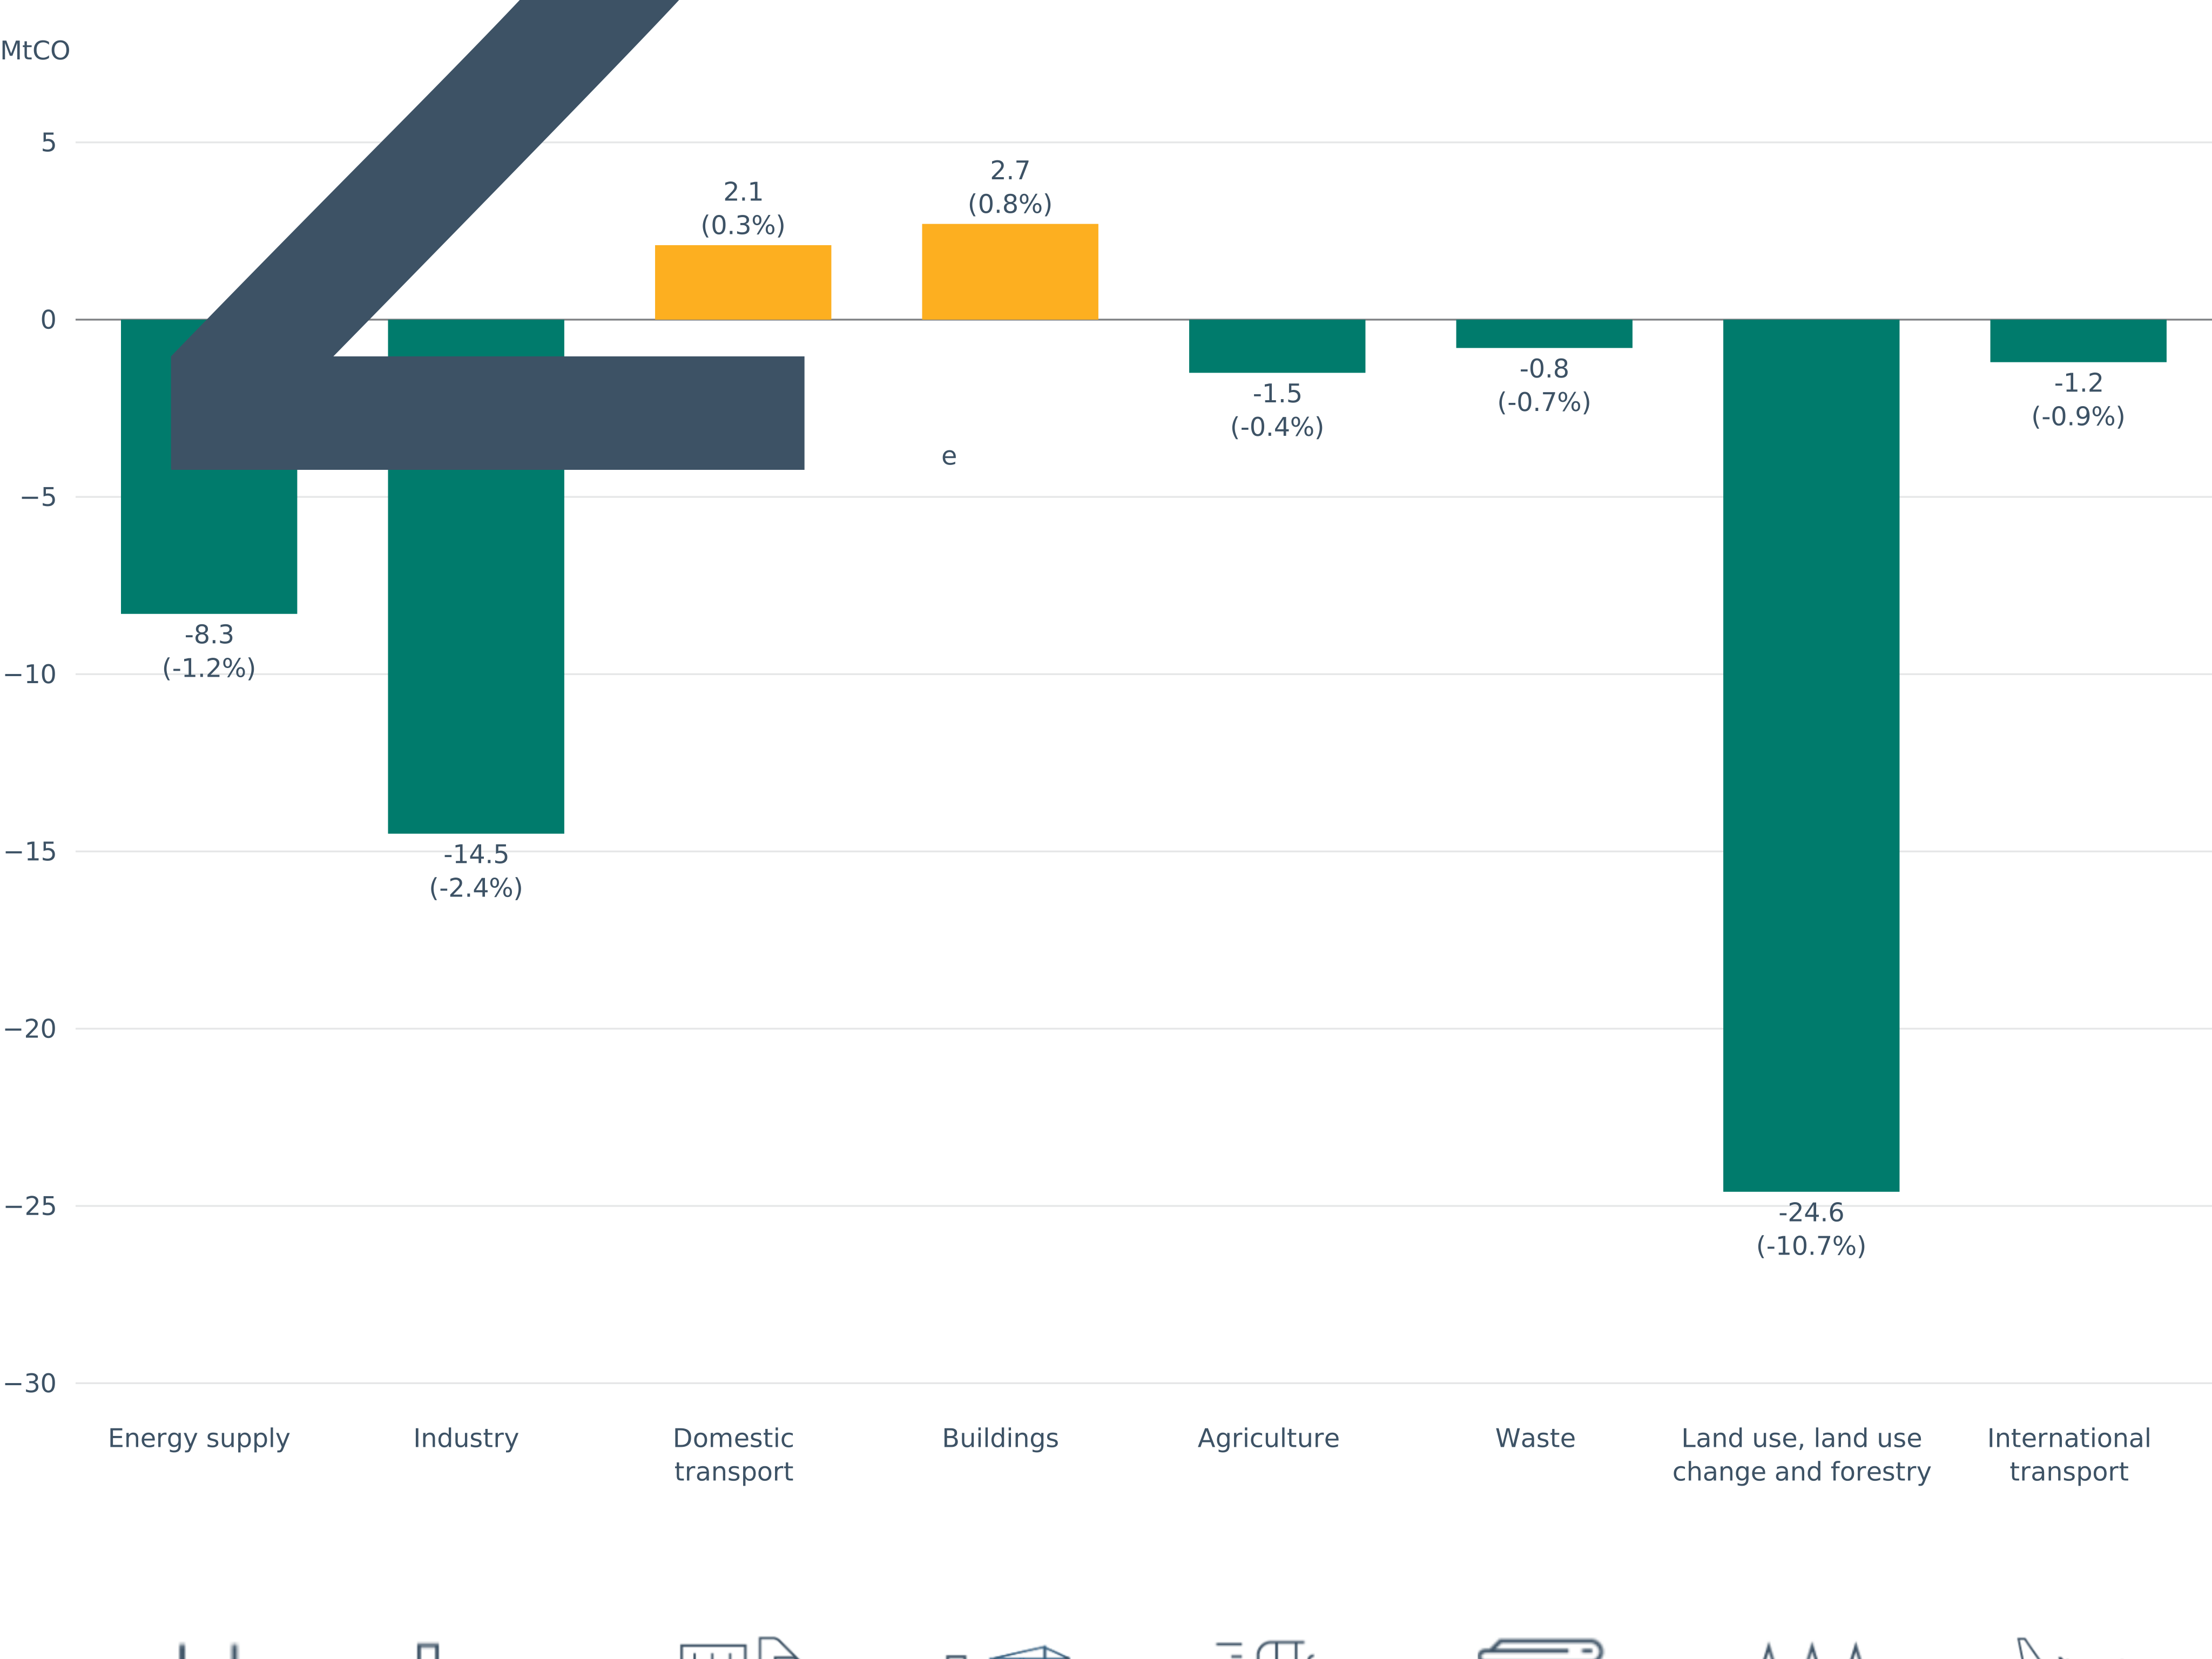
Change in EU GHG emission across sectors: 2025 vs 2024
This figure presents the emission reduction of the sector in 2025 compared to 2024, expressed in million tons of CO 2 -equivalents (Mton CO 2 e). The ‘Energy supply’ sector covers GHG emissions inventory categories 1.A.1 and 1.B; ‘Industry’ covers 1.A.2 and 2; ‘Domestic transport’ covers 1.A.3; ‘Waste’ covers category 5; ‘LULUCF’ is covered as reported under category 4; ‘International transport’ is covered as included under the European Climate Law target scope. Different to last year’s report ‘Buildings’ covers 1.A.4a+1.A.4.b; ‘Agriculture’ covers category 3 and 1.A.4.c.
Trends and projections: EU on track for 2030 emissions targets, but progress must accelerate
The EU is still on track to achieve its 2030 climate targets, according to the latest annual progress review published today by the European Environment Agency (EEA). The ‘Trends and Projections in Europe’ report shows emissions fell by 1.6% in 2025, according to preliminary figures. However, the pace of reductions in net greenhouse gas emissions slowed in 2025, highlighting how crucial it is to fully implement EU and national mitigation plans to reach the net 55% reduction target by 2030.