All official European Union website addresses are in the europa.eu domain.
See all EU institutions and bodies
An official website of the European Union | How do you know?
Environmental information systems
EN


EEA report 09/2025
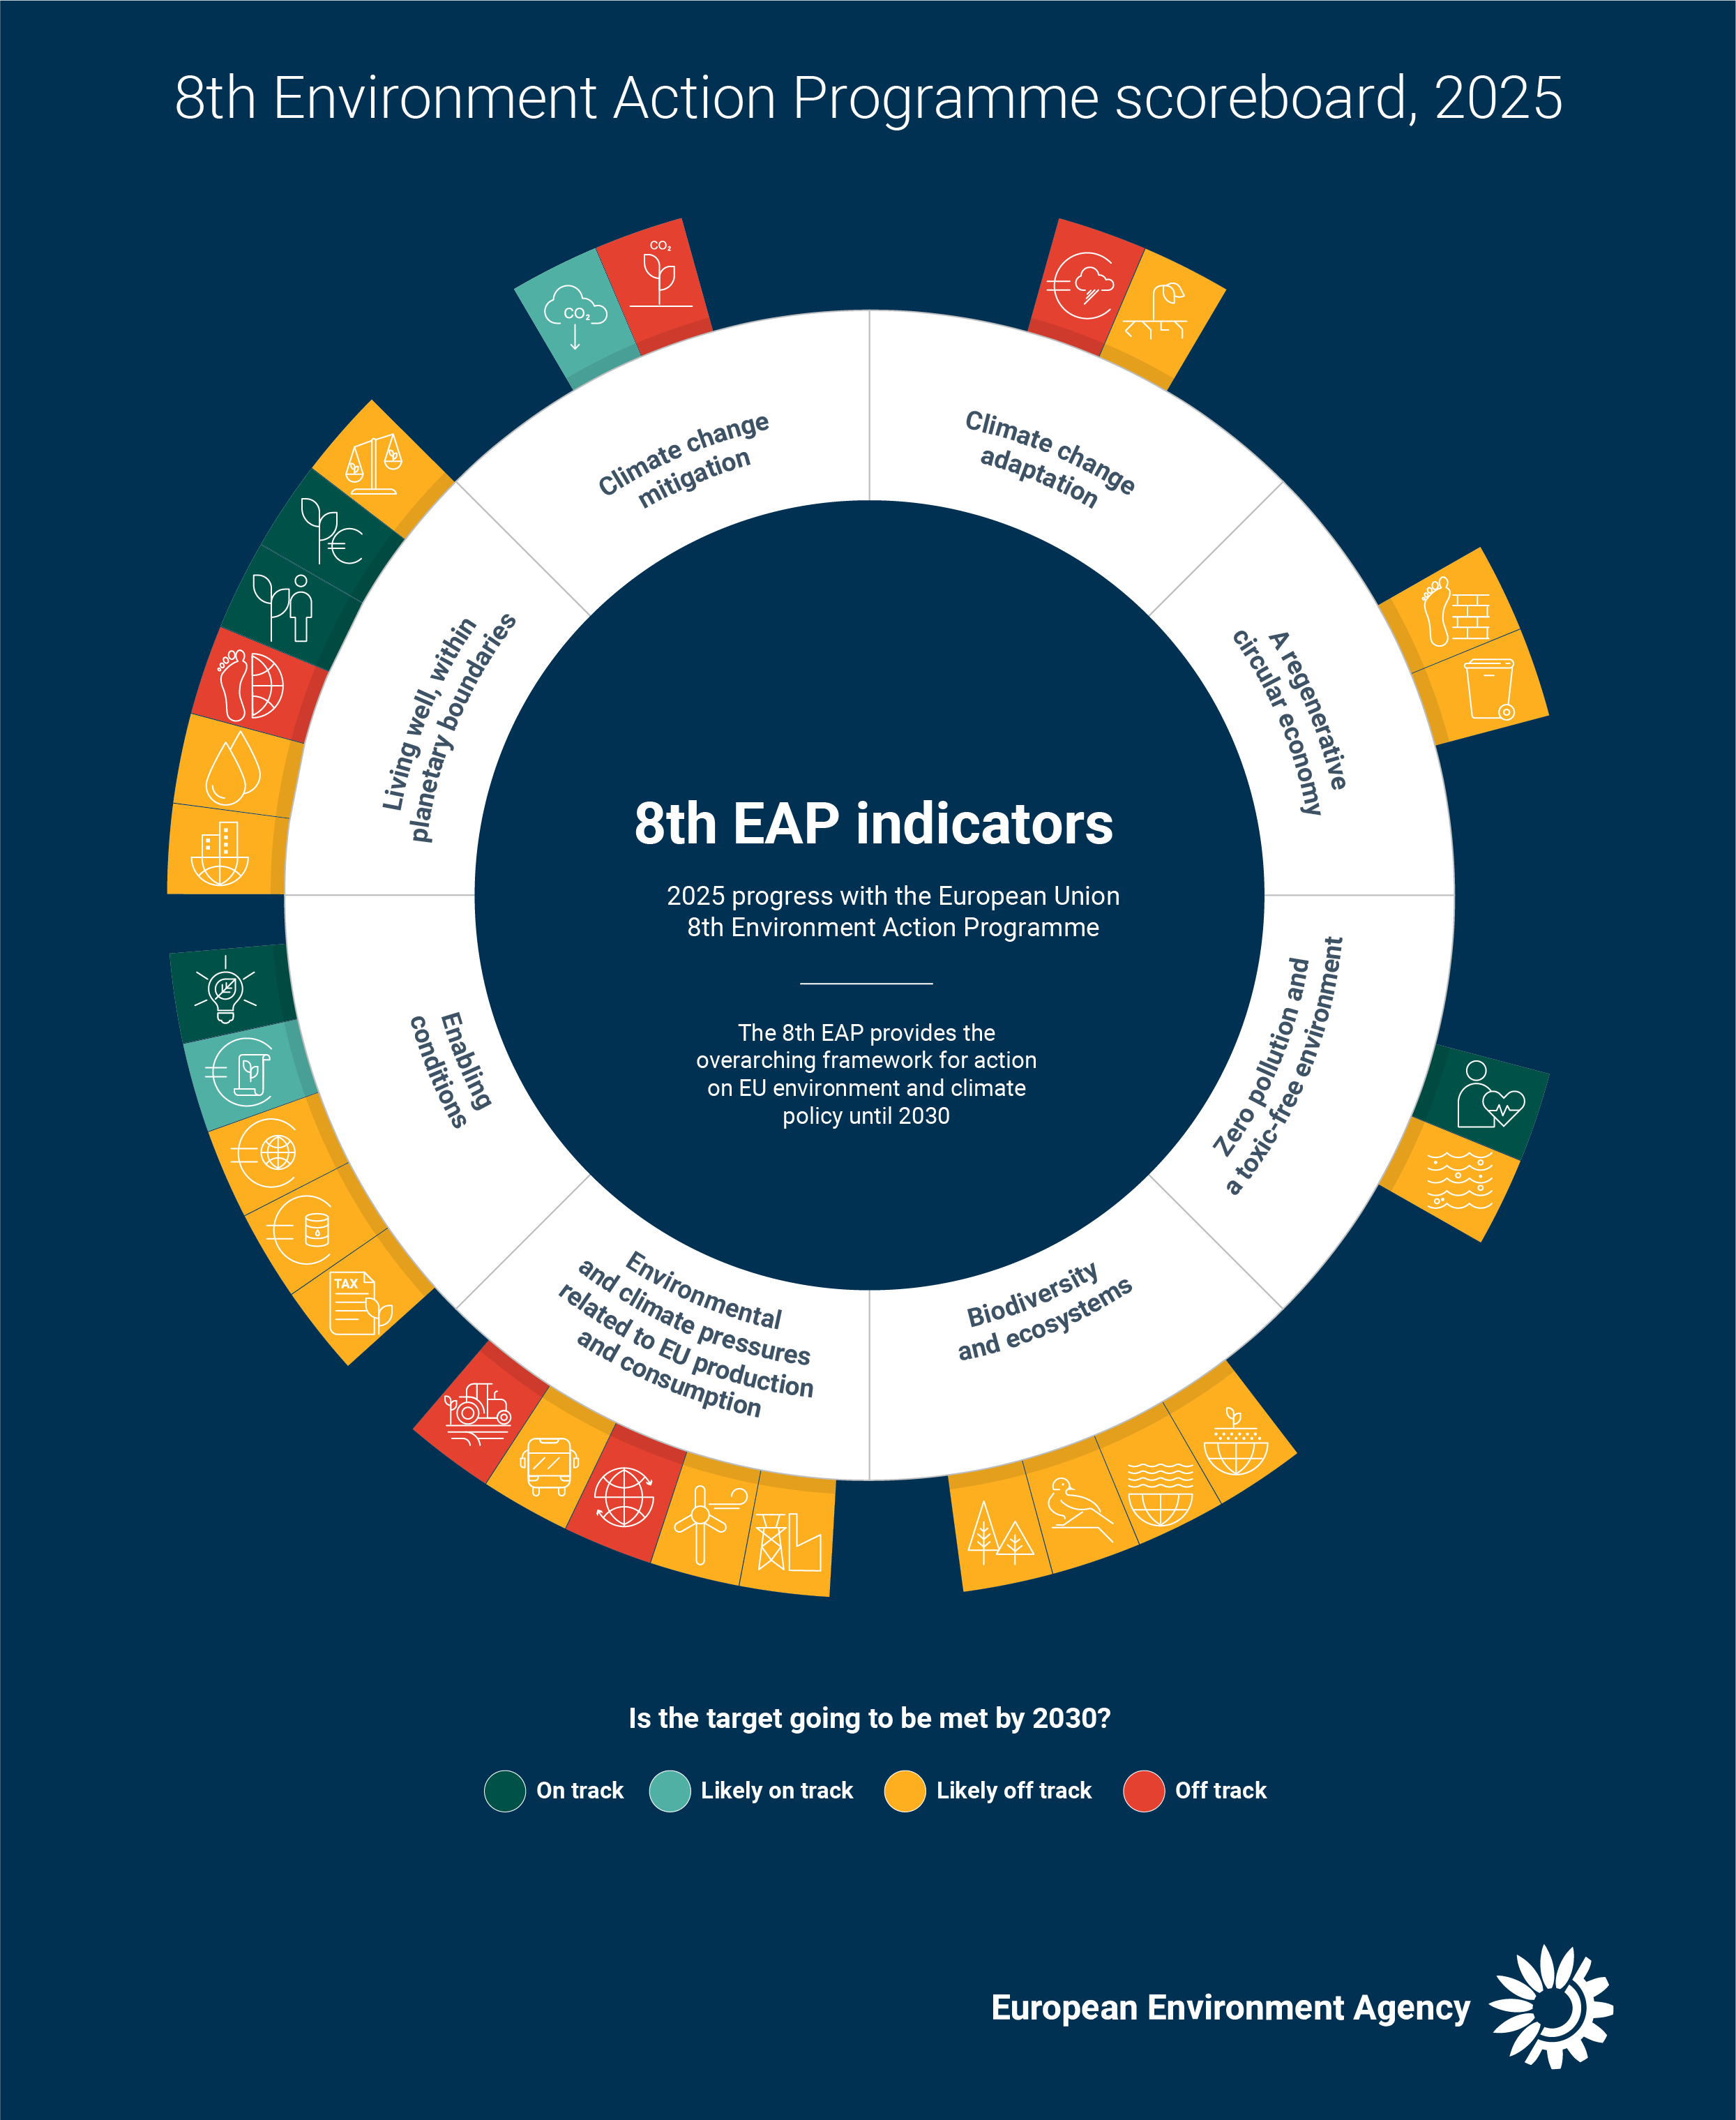
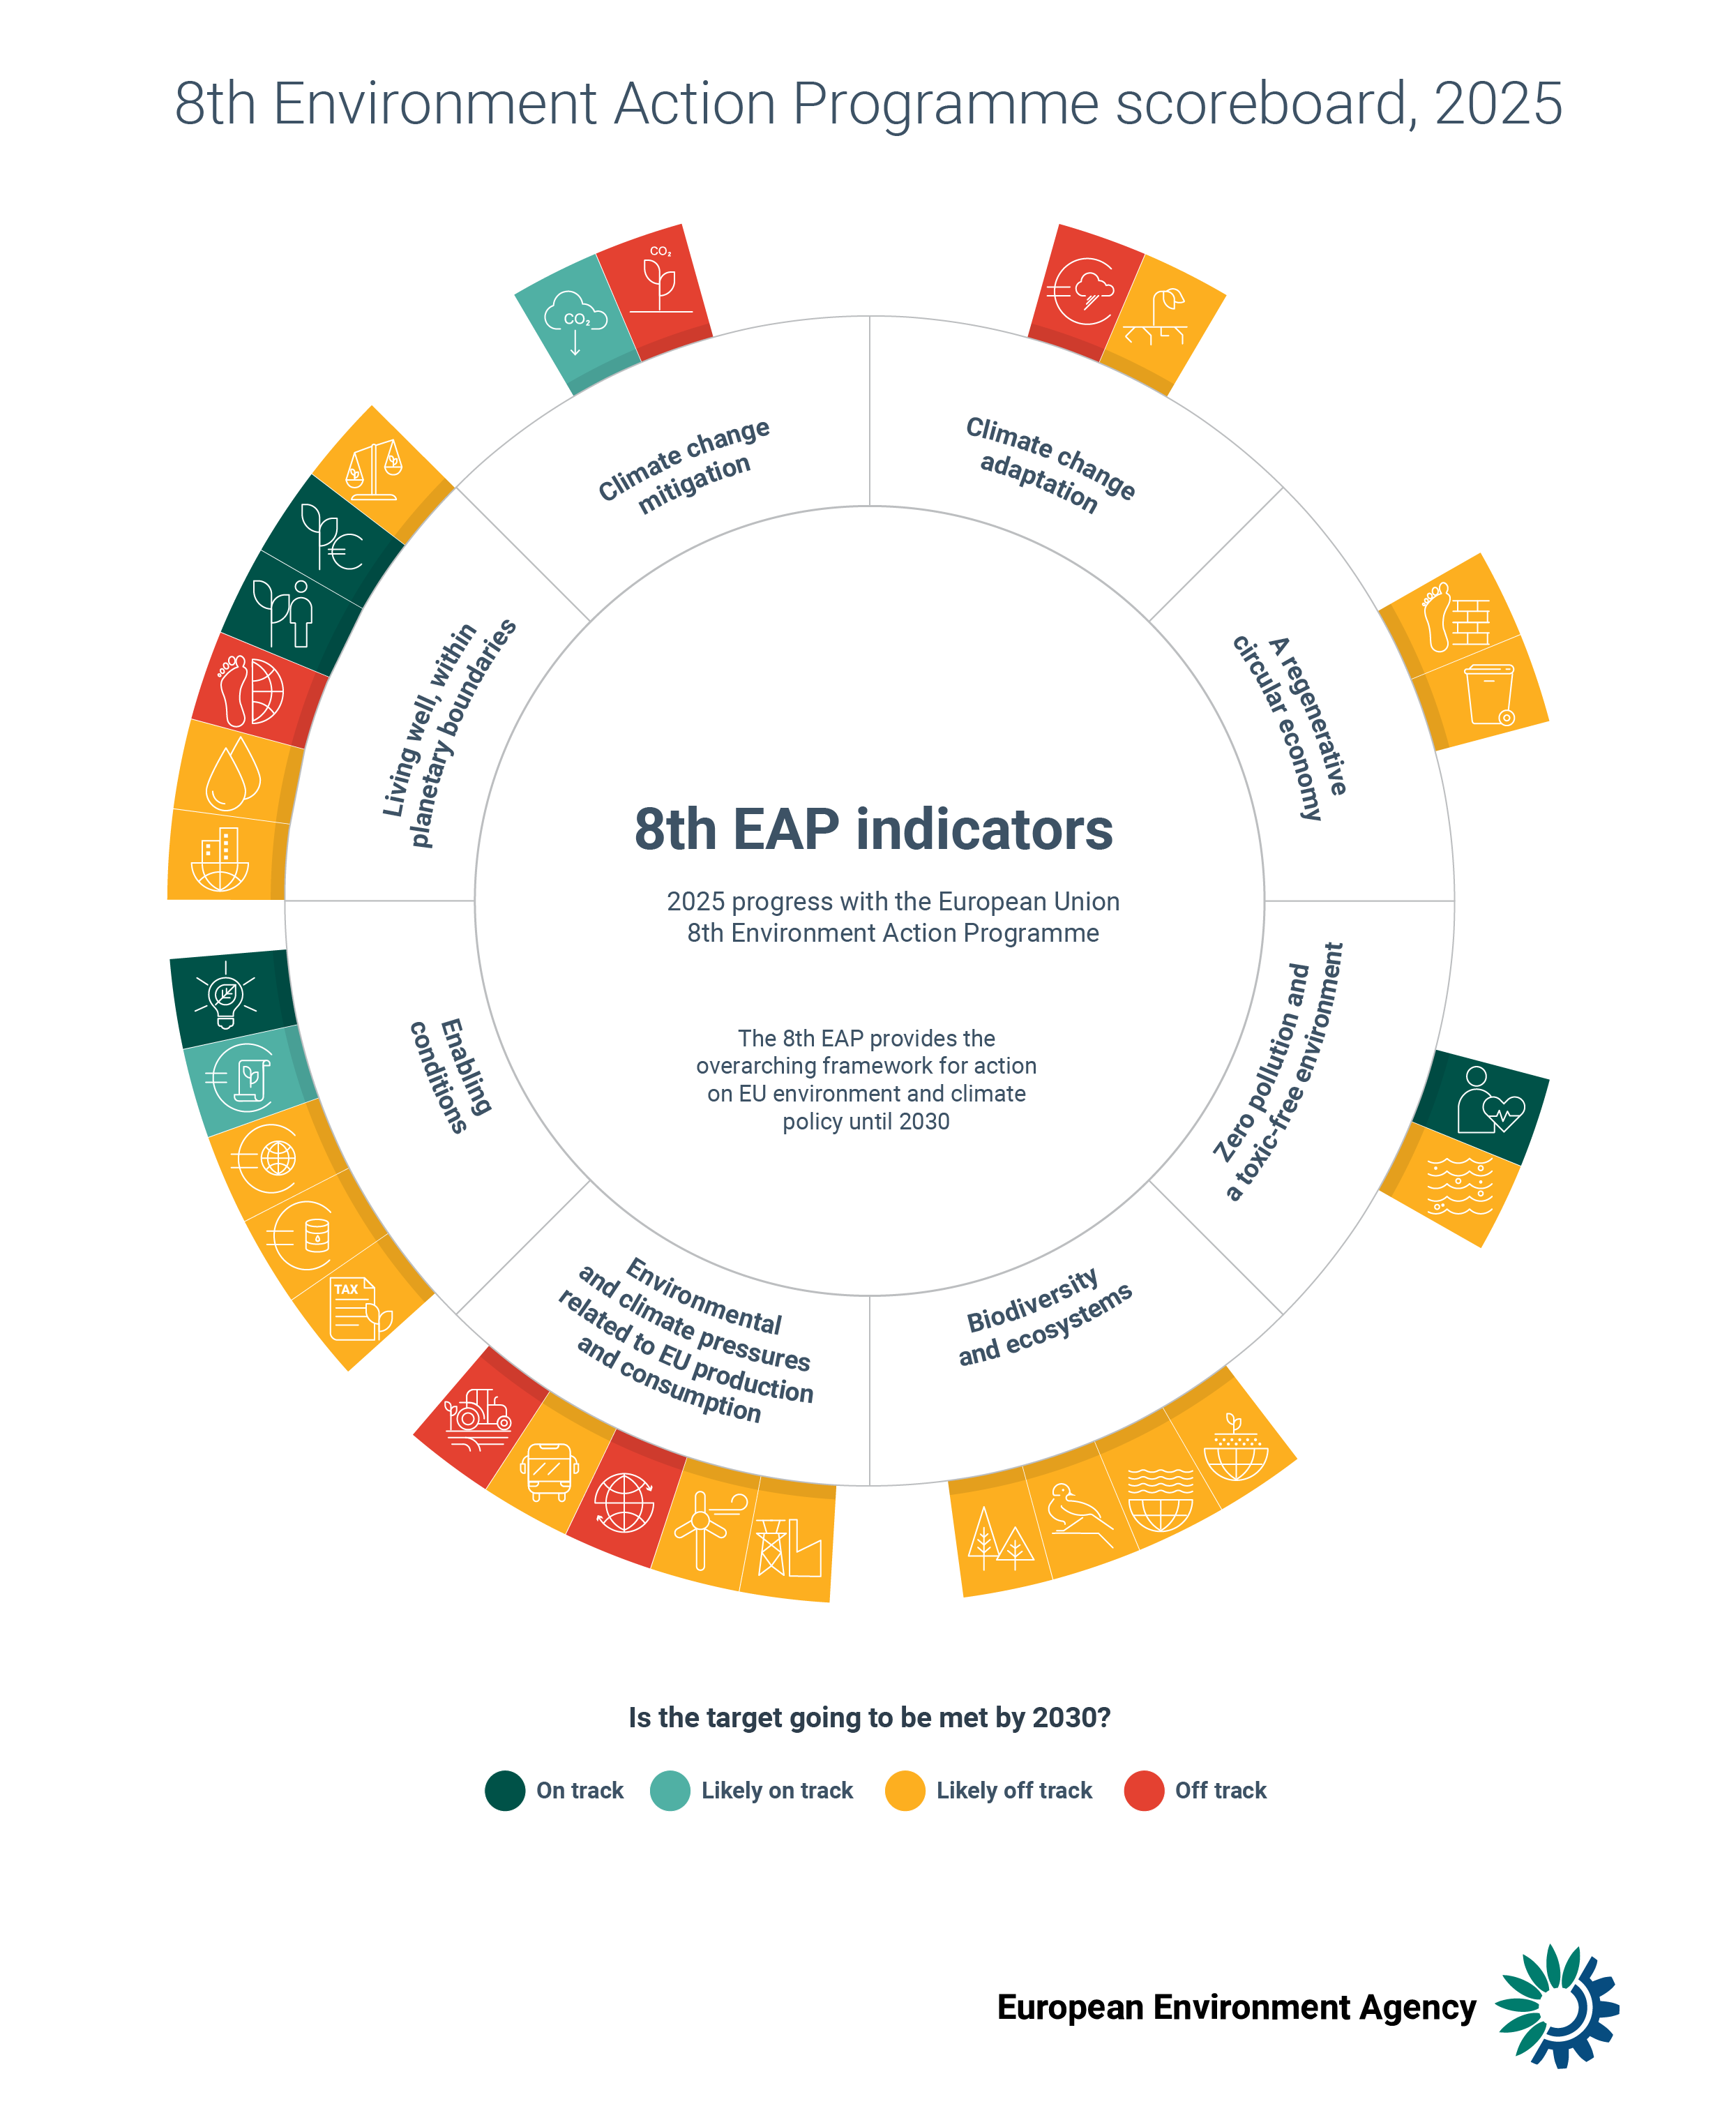
The EEA takes stock annually of progress towards the 8th Environment Action Programme (8th EAP) objectives on the basis of a set of 28 headline indicators and corresponding targets.
EN PDF: TH-01-25-041-EN-N - ISBN: 978-92-9480-748-9 - ISSN: 1977-8449 - doi: 10.2800/1667739

The Monitoring report on progress towards the 8th EAP 2025 objective is based on the set of 28 8th EAP indicators.
The indicator version used for this assessment was accessed in November 2025. The PDFs are available for download below.
Additional files of the Monitoring report on progress towards the 8th EAP objectives 2025 edition:



Share of utilised agricultural area used for organicfarming, EU
Organic farming in the EU has been continuously increasing since 2012 and reached an estimated 11.0 % of the utilised agricultural area (UAA) in 2023.

Green bonds as a percentage of total bonds issued by corporates (corporate bonds), by governments (sovereign bonds), and by both corporations and governments, EU
This figure shows green bonds, which are issued specifically to finance green projects (i.e. the proceeds from green bonds are earmarked for green projects), as a share of all bonds issued by corporates and governments in Europe. The use of proceeds is typically guided by a set of criteria or green bond frameworks. The average values include the issuance of all bonds issued by corporates and governments in the calendar year that were issued in a country of the European Union. To be included in the calculation, the bond must be listed with the data provider. Only sovereign bonds issued by governments with a maturity of more than one year are included. The shares per type of issuer include all bonds and green bonds issued by corporates and governments.

EU consumption footprint, broken down by impact category
The figure shows the weighted impacts from the entire EU consumption over time, indexed to 2010.