All official European Union website addresses are in the europa.eu domain.
See all EU institutions and bodiesAn official website of the European Union | How do you know?
Environmental information systems
EN
Maps and charts from Europe's environment 2025
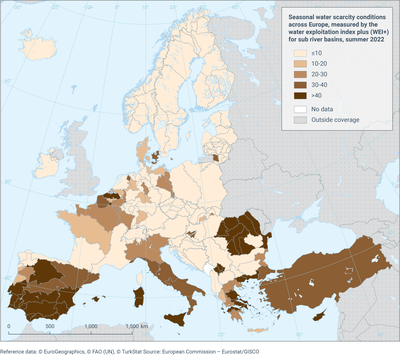
Seasonal water scarcity conditions for European sub river basins during summer 2022, as measured by water exploitation index plus (WEI+).
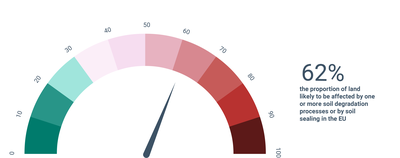
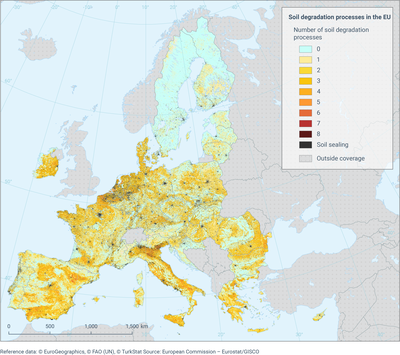
The map shows where current scientific evidence converges to indicate areas that are likely to be affected by soil degradation. 18 soil degradation processes are included.
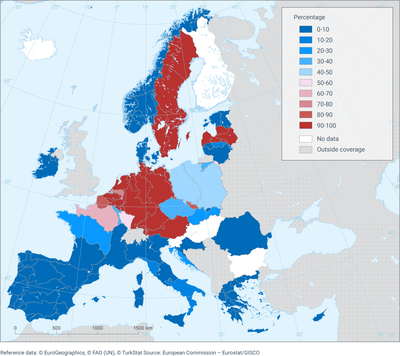
The map shows the percentage of European surface water bodies failing to achieve good chemical status in 2021, by River Basin District, for substances where the environmental quality standard is set to protect human health under the EU Water Framework Directive. The substances included in this map are benzo(a)pyrene, brominated diphenylethers, dioxins and dioxin-like compounds, fluoranthene, heptachlor and heptachlor epoxide. Most failures owe to the presence of brominated diphenylethers.

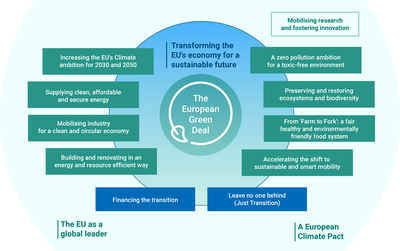
The European Green Deal Investment Plan (EGDIP) is the investment pillar of the Green Deal. To achieve the goals set by the European Green Deal, the Plan will mobilise at least €1 trillion in sustainable investments over the next decade.
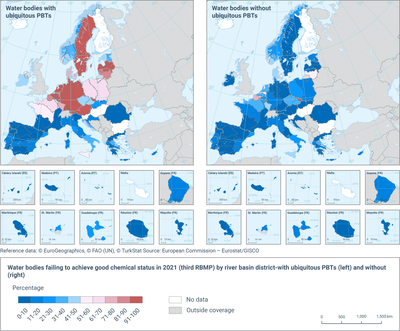
The map shows the percentage of European surface water bodies failing to achieve good chemical status in 2021, by River Basin District under the EU Water Framework Directive. The map on the left shows the status for all Priority Substances, while that on the right shows the status without the subset of ubiquitous Persistent, Bioaccumulative and Toxic substances (uPBTs) set by the Environmental Quality Standards Directive. Most failures of chemical status owe to the presence of mercury and brominated diphenylethers, which are both uPBTs.
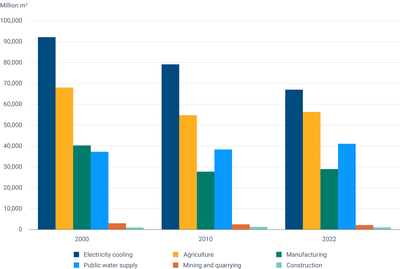
The graph presents annual total water abstraction by economic sectors in the 27 EU Member States, 2000-2022. The economic sectors are agriculture (NACE A), mining and quarrying (NACE B), manufacturing (NACE C), electricity cooling (NACE D CL), public water supply (NACE E-36, and group of NACE G-U) and construction (NACE F), as classified in the NACE (Statistical Classification of Economic Activities in the European Communities) sections. Hydropower is excluded.
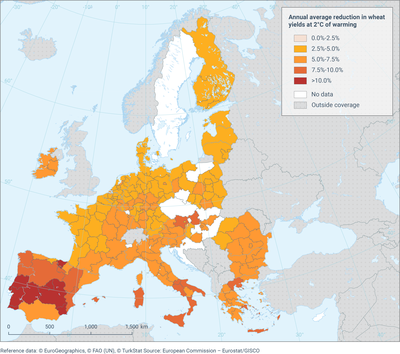
Reduction in wheat yield [%]: average annual loss in wheat yields due to drought. Values are expressed as a percentage of the average expected value.