All official European Union website addresses are in the europa.eu domain.
See all EU institutions and bodiesAn official website of the European Union | How do you know?
Environmental information systems
EN
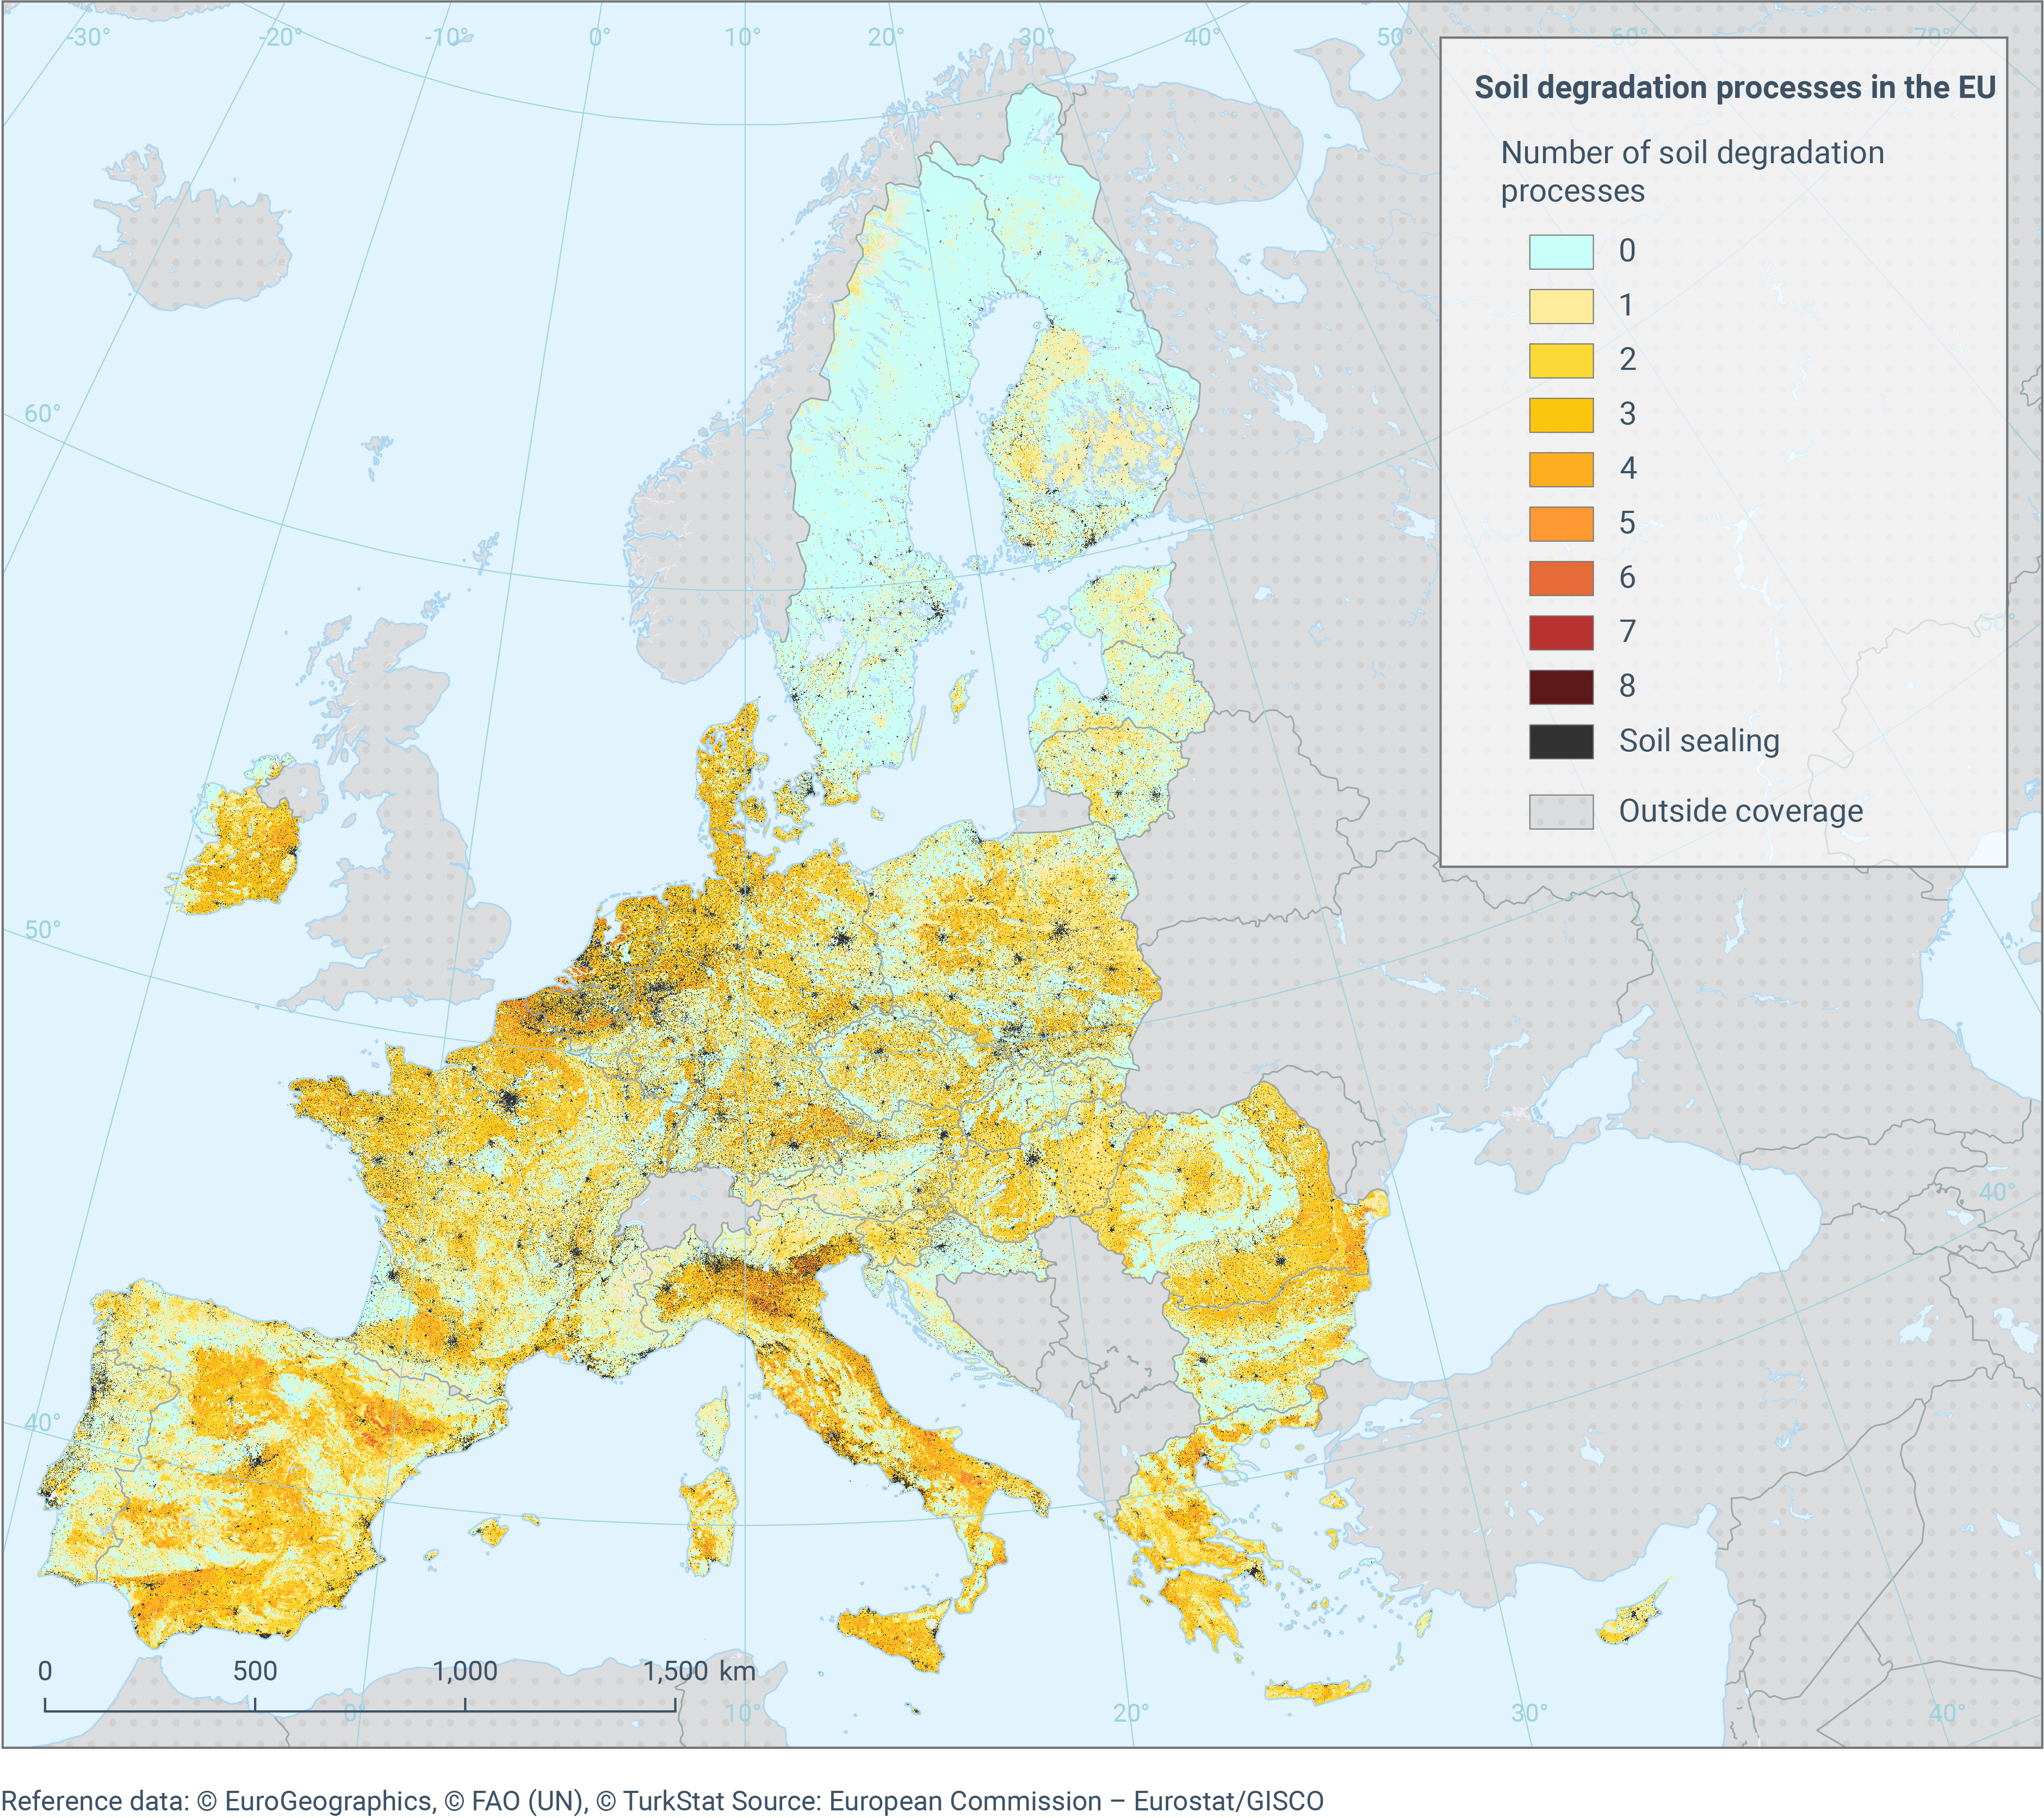
The map shows where current scientific evidence converges to indicate areas that are likely to be affected by soil degradation. 18 soil degradation processes are included.
Map-package.zip
Loading