All official European Union website addresses are in the europa.eu domain.
See all EU institutions and bodiesAn official website of the European Union | How do you know?
Environmental information systems
EN
A carefully selected set of indices covering the main climate-related hazards for Europe has been put together from available data sources by experts in the field. These 32 indices are organised according to 16 hazards and are grouped into six categories consistent with the ‘climatic impact drivers’ adopted in the Intergovernmental Panel on Climate Change (IPCC) Sixth Assessment Report. These categories and the key take-home messages from the EEA’s interactive report on Europe’s changing climate hazards are found below.
Key messages
Heat and cold. Mean air temperature will rise steadily across Europe. As a result, growing degree days and cooling degree days will increase, whereas heating degree days and days with frost will decrease. Hot extremes are expected to increase even faster than mean temperatures. Humid heatwaves, which pose a great risk to human health, are projected to increase rapidly across Europe.
Wet and dry. Projected changes in annual precipitation are expected to differ considerably across regions and seasons. In northern Europe, annual precipitation and heavy rainfall are likely to increase, with droughts becoming less frequent. Mixed changes are expected for summer rainfall, flooding events, aridity and fire hazards. Central Europe is likely to experience lower summer rainfall, but also harsher weather extremes (heavy precipitation, river floods, droughts and fire hazards), with mixed changes in annual precipitation and aridity. In southern Europe, annual precipitation and summer rainfall are projected to decrease, whereas aridity, droughts and fire hazards are all likely to increase. Mixed changes are projected for heavy precipitation and river floods.
Wind. Climate models anticipate relatively minor changes in mean wind speed. Storm intensity is projected to increase across Europe, but changes in the frequency are projected to differ across regions.
Snow and ice. Snowfall is projected to decrease in central and southern Europe, whereas mixed changes are anticipated for northern Europe. Snow cover is projected to decrease across Europe.
Coastal. Most coastal regions in Europe will experience further increases in mean and extreme sea levels, with the exception of the northern Baltic Sea, where land levels are still rising following the last ice age.
Open ocean. Sea surface temperature is projected to increase in all European regional seas, with associated increases in marine heatwaves. Europe’s seas are also expected to become more acidic.
32 climate indices for the 16 climate hazards, grouped into six hazard types, as identified by the Intergovernmental Panel on Climate Change (IPCC) in its Sixth Assessment Report:
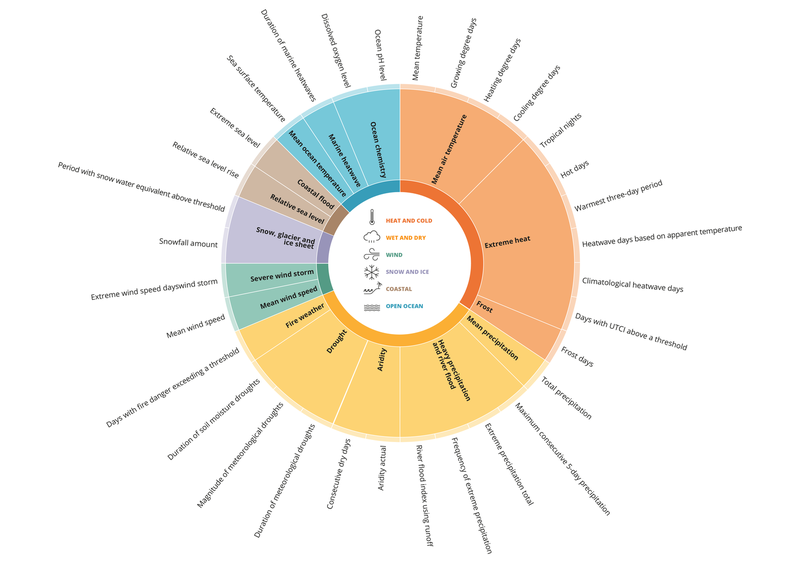
Projected changes in climate-related hazards across Europe during the 21st century (click on the hazards to access detailed information and the visualisations)
Category
| Hazard | Index name
| Northern Europe | Central Europe | Southern Europe |
|---|---|---|---|---|---|
Mean temperature | ↗ | ↗ | ↗ | ||
Growing degree days | ↗ | ↗ | ↗ | ||
Heating degree days | ↘ | ↘ | ↘ | ||
Cooling degree days | ↗ | ↗ | ↗ | ||
Tropical nights | ↗ | ↗ | ↗ | ||
Hot days | ↗ | ↗ | ↗ | ||
Warmest three-day period | ↗ | ↗ | ↗ | ||
Heatwave days based on apparent temperature | ↗ | ↗ | ↗ | ||
Climatological heatwave days | ↗ | ↗ | ↗ | ||
Days with Universal Thermal Climate Index (UTCI) above a threshold | This index has increased in recent decades in central and southern Europe whereas no robust trend was detected for northern Europe. Projections are not currently available. | ||||
Frost days | ↘ | ↘ | ↘ | ||
Total precipitation | Annual: ↗ Summer: ⤨ | Annual: ⤨ Summer: ↘ | Annual: ↘ Summer: ↘ | ||
Maximum consecutive 5-day precipitation | ↗ | ↗ | ⤨ | ||
Extreme precipitation total | ↗ | ↗ | → | ||
Frequency of extreme precipitation | ↗ | ↗ | → | ||
River flood index using runoff | ⤨ | ↗ | ⤨ | ||
Aridity actual | ↗ | ⤨ | ↗ | ||
Consecutive dry days | → | ↗ | ↗ | ||
Duration of meteorological droughts | ↘ | ⤨ | ↗ | ||
Magnitude of meteorological droughts | ↘ | ↗ | ↗ | ||
Duration of soil moisture droughts | Increasing soil moisture droughts are projected for southern Europe. Constant or increasing droughts are projected for central Europe, and constant or decreasing droughts are projected for northern Europe. | ||||
Days with fire danger exceeding a threshold | → | ↗ | ↗ | ||
Mean wind speed | → | → | → | ||
Extreme wind speed days |
Increasing frequency and intensity of storms is projected for northern and central Europe; decreasing storm frequency but increasing intensity is projected for southern Europe. | ||||
Snowfall amount | ⤨ | ↘ | ↘ | ||
Period with snow water equivalent above threshold | ↘ | ↘ | ↘ | ||
Relative sea level rise | ↗ ** | ↗ | ↗ | ||
Extreme sea level | ↗ ** | ↗ | ↗ | ||
Sea surface temperature | ↗ | ↗ | ↗ | ||
Duration of marine heatwaves | Projected increase in all European regional seas | ||||
Dissolved oxygen level | Most stations exhibit no robust trends in recent decades, but some stations in the Baltic Sea and the Greater North Sea show decreasing oxygen levels. Projections are not available. | ||||
Ocean pH level | Surface ocean pH levels are projected to decline (i.e., the water becomes more acidic) both in the open ocean and in enclosed seas. |
Legend:
↗ Increase throughout most of a region / Europe
↓ Decrease throughout most of a region / Europe
⤨ Increases as well as decreases in a region / Europe
→ No significant changes from the current situation
Notes:
- Information refers to a high emissions (or forcing) scenario (i.e., RCP8.5); lower emissions scenarios usually show the same direction of projected change, but lower magnitude and/or robustness.
- ‘Europe’ refers to the land area of the 38 EEA member and cooperating countries (EEA-38) as of 1 February 2020. ‘Coastal’ indices refer to the coastline of EEA-38. ‘Open ocean’ indices refer to the European regional seas.
- The three European subregions (‘Northern’, ‘Central’ and ‘Southern’) are mostly consistent with the three IPCC climate reference regions in the IPCC AR6 that cover the EEA-38 countries (NEU, WCE and MED; see Section 2.2 for details).
- (*) This hazard category comprises two climatic impact driver categories from the IPCC Sixth Assessment Report
- (**) Relative sea level and extreme sea level may decrease in the northern Baltic Sea due to isostatic adjustment.
Please see here for a more detailed version of this overview table.