All official European Union website addresses are in the europa.eu domain.
See all EU institutions and bodies
An official website of the European Union | How do you know?
Environmental information systems
EN

- БългарскиBG
- češtinaCS
- HrvatskiHR
- danskDA
- NederlandsNL
- ελληνικάEL
- EnglishEN
- eestiET
- SuomiFI
- FrançaisFR
- DeutschDE
- magyarHU
- ÍslenskaIS
- italianoIT
- LatviešuLV
- lietuviųLT
- MaltiMT
- NorskNO
- polskiPL
- PortuguêsPT
- RomânăRO
- slovenčinaSK
- SlovenščinaSL
- EspañolES
- SvenskaSV
- TürkçeTR

Annual days with high fire danger (FWI value > 30) for the European land area and sub-regions
Chart (static)
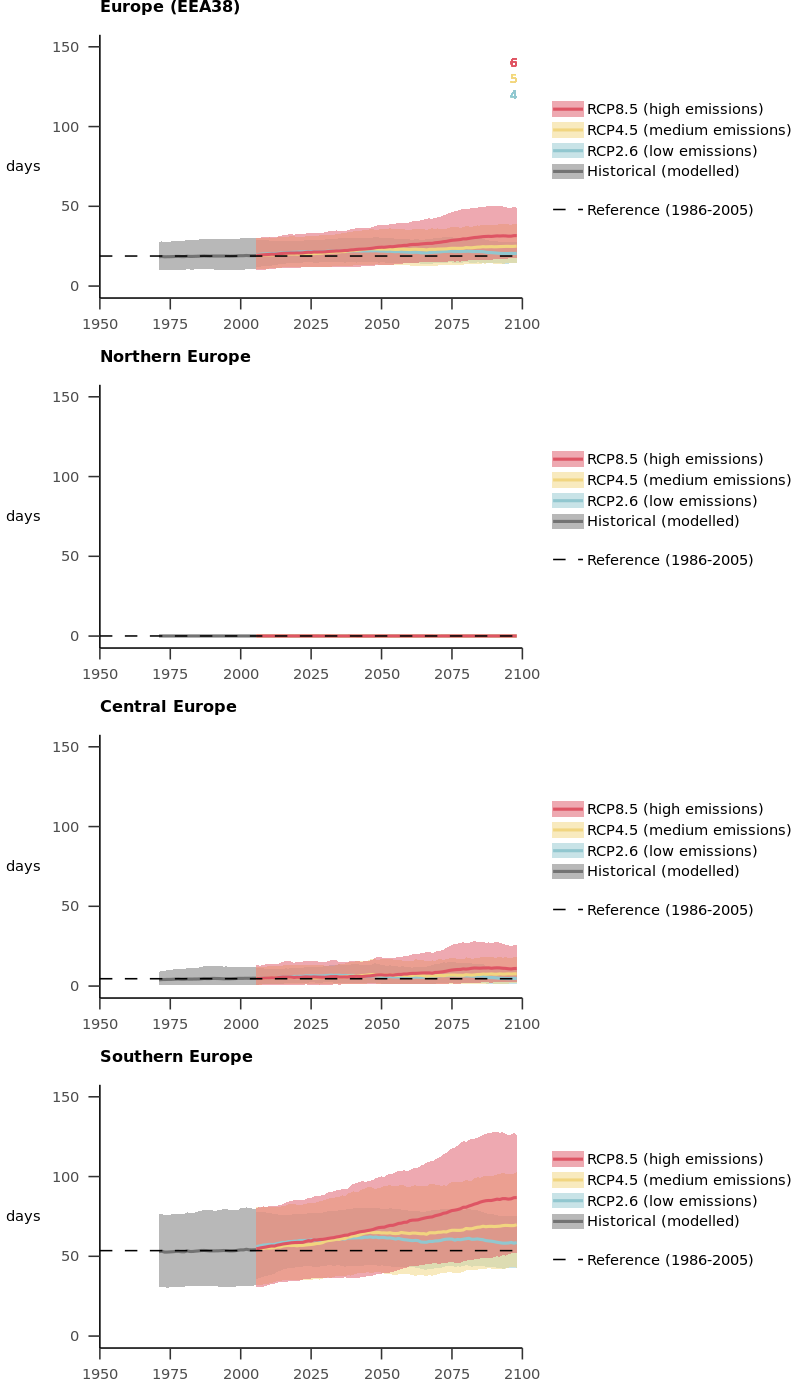
Solid grey, blue, yellow and red lines represent the ensemble mean of projections for the historical period and under low-, medium- and high-emissions scenarios (RCP2.6, RCP4.5 and RCP8.5, respectively) (smoothed by a 20-year moving average) from 1971 to 2098. Shaded areas show the lower (minimum) and upper (maximum) bounds of the model ensembles. The dashed horizontal lines show the means for 1986-2005 computed from the model ensemble means of historical simulations. The size of the model ensemble used for each scenario is shown by the coloured numbers in the top-right corner.
Downloads
Data sources
Metadata
More info
Loading