All official European Union website addresses are in the europa.eu domain.
See all EU institutions and bodies- БългарскиBG
- češtinaCS
- HrvatskiHR
- danskDA
- NederlandsNL
- ελληνικάEL
- EnglishEN
- eestiET
- SuomiFI
- FrançaisFR
- DeutschDE
- magyarHU
- ÍslenskaIS
- italianoIT
- LatviešuLV
- lietuviųLT
- MaltiMT
- NorskNO
- polskiPL
- PortuguêsPT
- RomânăRO
- slovenčinaSK
- SlovenščinaSL
- EspañolES
- SvenskaSV
- TürkçeTR
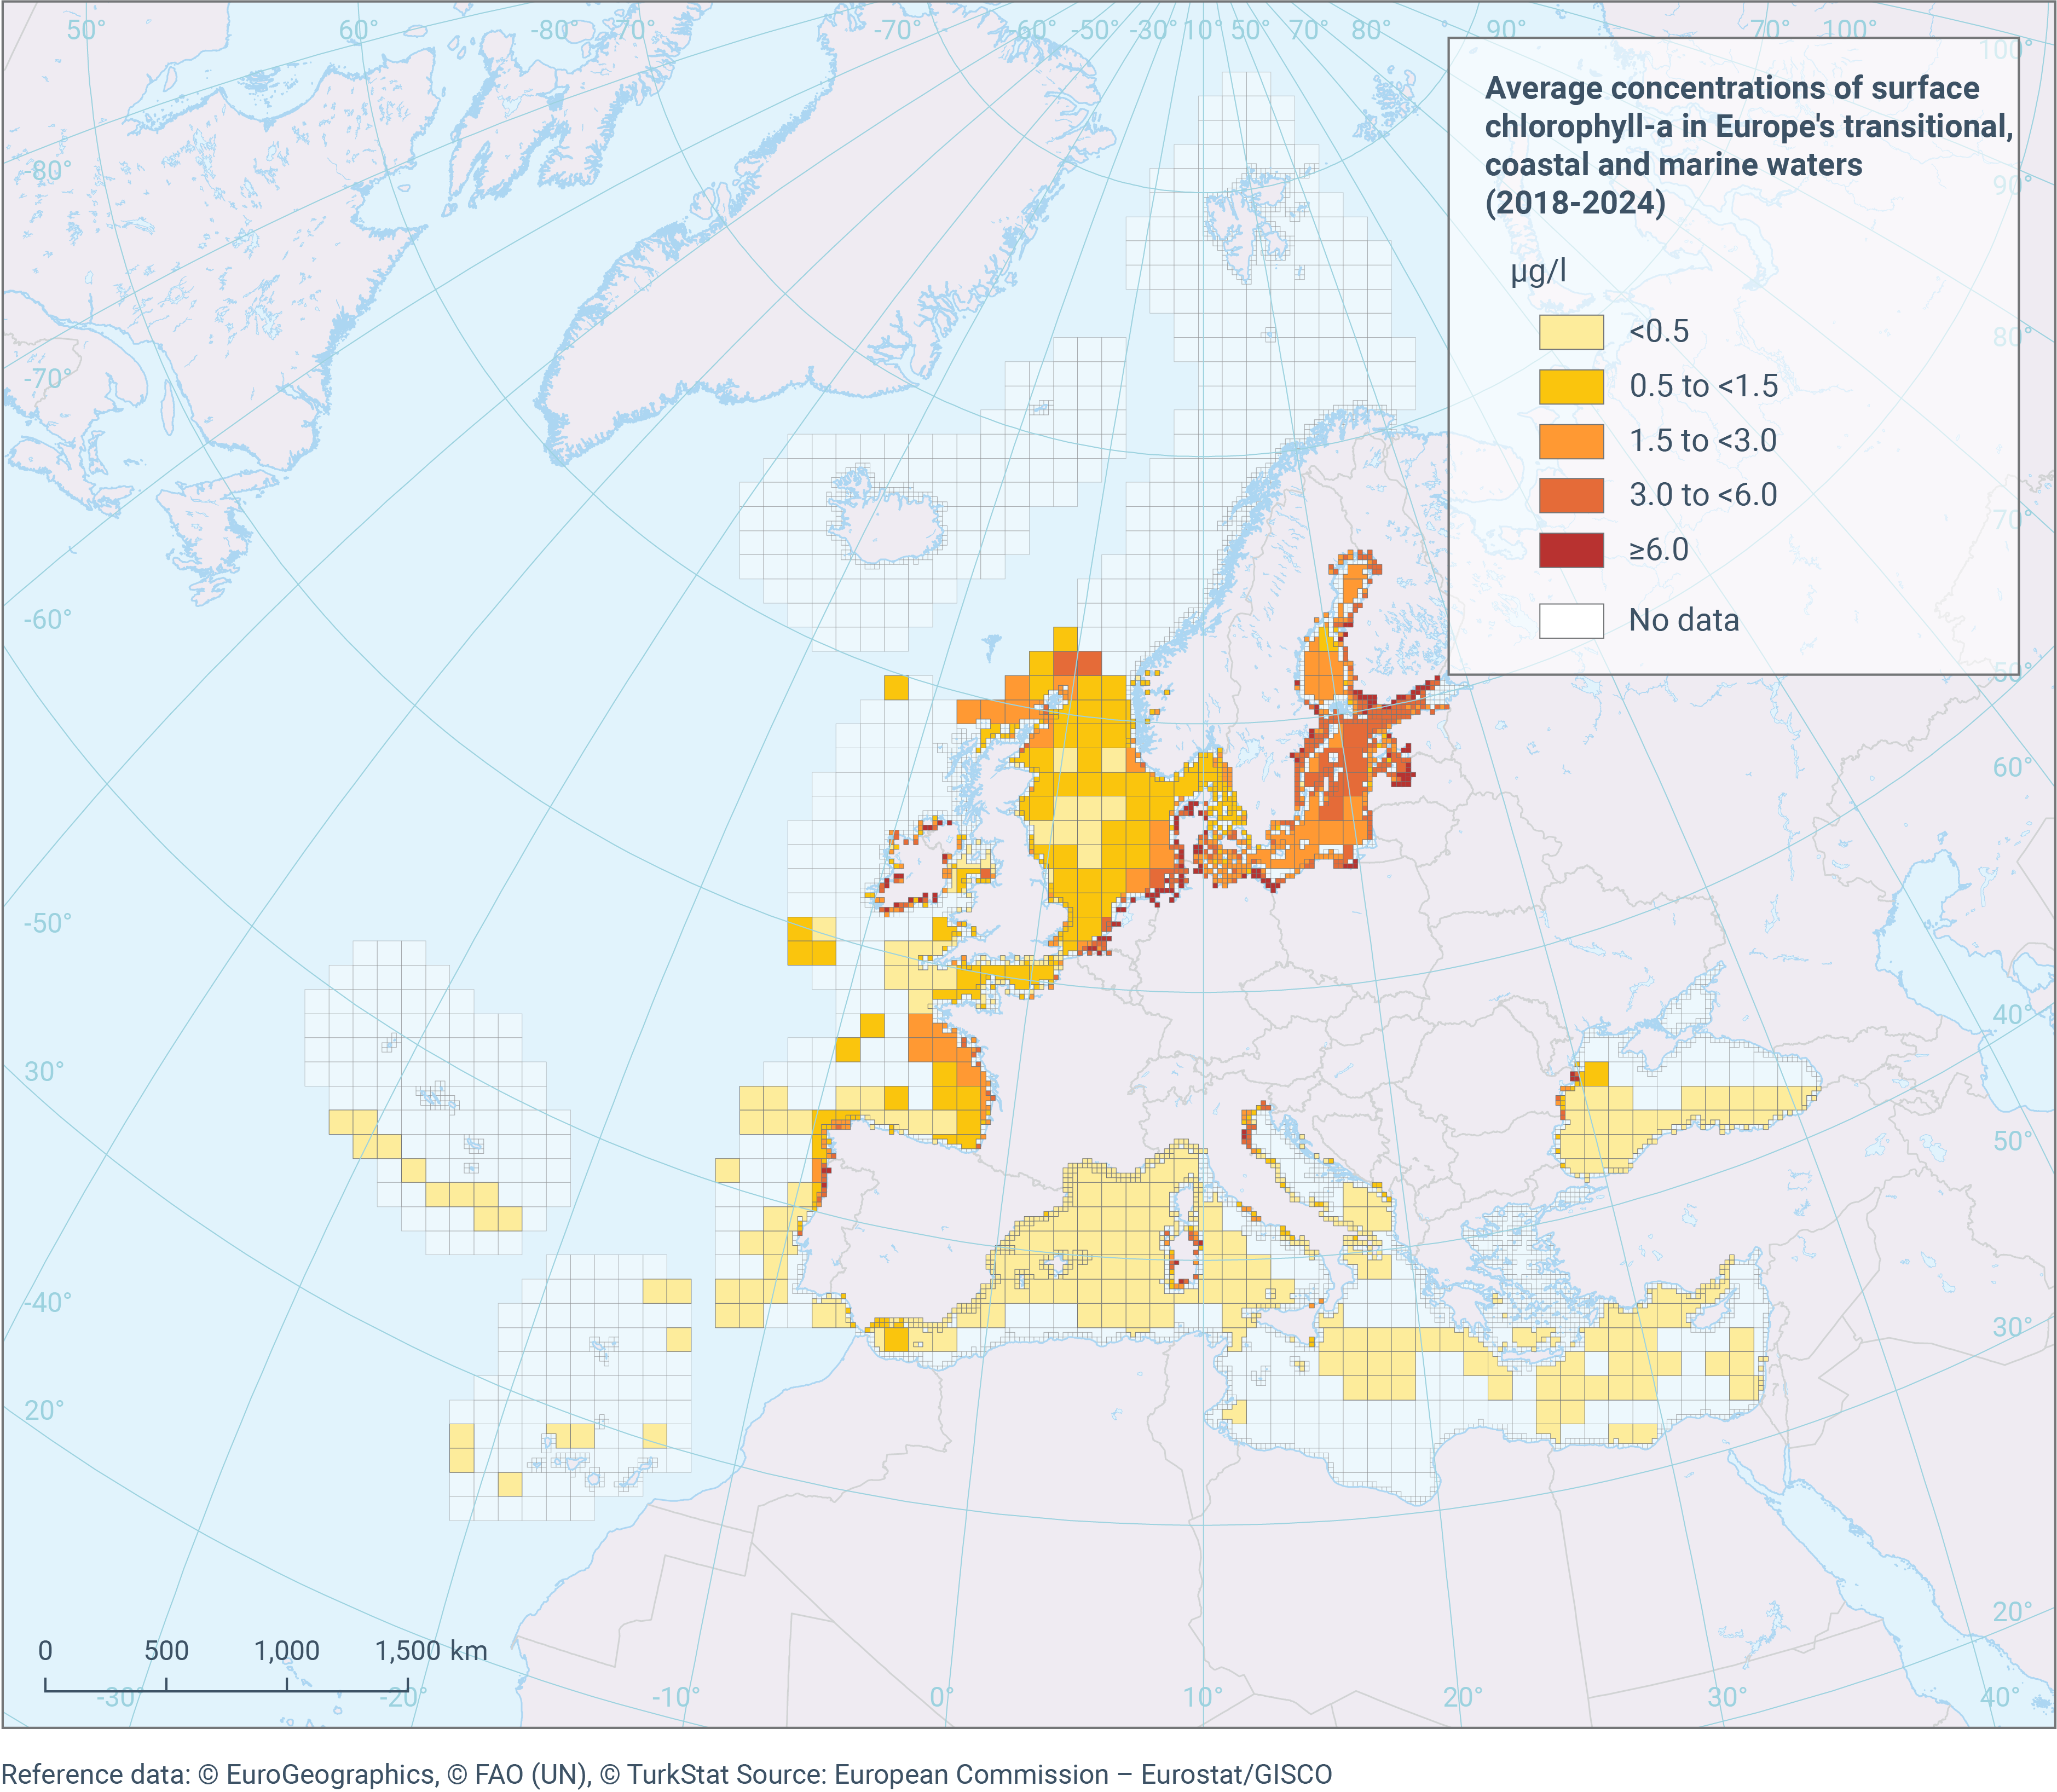
Average concentrations of surface chlorophyll-a in Europe's transitional, coastal and marine waters (2018-2024)
Map (static)
The map shows the average summer chlorophyll-a (Chl-a) concentrations in the upper 10m of the water column across European seas for the period 2018-2024. Concentrations are grouped into five classes (µg/l): <0.5, 0.5 to <1.5, 1.5 to <3.0, 3.0 to <6.0, and ≥6.0.
- Oceanographic database, International Council for the Explaration of the Sea (ICES)
- Chemistry data - Data & products on marine water quality, European Marine Observation and Data Network (EMODnet)
- WISE SoE - Water Quality (WISE-6), European Environment Agency (EEA)
Additional information
* Average chlorophyll-a concentrations (µg/l) are derived from observations collected at depths of less than 10m during the growing (summer) season.
* Records flagged as poor quality (bad value, probably bad value), uncertain quality (value in excess, uncertain value, missing value), or duplicates are excluded. In addition, values above the 99.9th percentile are removed to reduce the influence of extreme outliers.
* Observations are aggregated into grid cells with a resolution of 1,375km for coastal stations located within 20km of the coastline and 5.5km for offshore stations located more than 20km from the coastline. A 5km coastal mask is applied, and the aggregated data are subsequently transferred to the official EEA assessment hybrid grid, with a resolution of 20km in coastal waters and 100km in offshore waters.
* Annual average concentrations are calculated using a combination of estimated marginal means (EMMs) and arithmetic means. EMMs are applied to time series containing observations from multiple months and years, while arithmetic means are used for time series with annual observations only.
* The average summer concentration for 2018-2024 is then calculated as the mean of the annual averages for each assessment grid cell.