All official European Union website addresses are in the europa.eu domain.
See all EU institutions and bodies
An official website of the European Union | How do you know?
Environmental information systems
Land use and land use change are fundamental for sustainable resource use and the delivery of ecosystem services, including the provision of food, nutrient cycling and climate change mitigation through carbon sequestration. Land resources are part of our shared natural capital and must be well managed to maintain a healthy environment and human well-being (EEA, 2019b). As such, only if land use and its impacts are properly addressed is progress towards sustainable development in Europe possible. Land-use related policies require the development of harmonised datasets, transparent methodologies and easily interpretable statistics. Land accounts fit the bill, describing how land resource stocks change over time. This briefing describes the use of the EEA’s Integrated Data Platform and CORINE Land cover data for transparent, repeatable and efficient land accounting.
Key messages
Environmental impacts such as the loss of productive land, the decline in biodiversity and soil carbon stocks, flood regulation and other ecosystem services are related to land use and land use change in Europe.
Satellite land cover data — such as those provided by Copernicus — can support land use change monitoring. The data loaded in an accounting matrix show land cover gains and losses over time and can inform policy action on the main land use processes.
The European Environment Agency has developed land and ecosystem accounts that are aligned with the United Nations System of Environmental Economic Accounting, as well as an Integrated Data Platform, which together facilitate the consistent, systematic and rapid calculation of accounts.
Policy relevance of land accounting
Land is a resource that supports important production functions and ecosystem services, such as the provision of food and fibre, the maintenance of nutrient cycling, terrestrial biodiversity, water regulation and purification, and climate change mitigation (EEA, 2019a). The integration of land cover, land use and land use change data with other thematic areas is required to address the climate and environmental sustainability priorities of the European Green Deal and other EU policies.
At a global level, land degradation neutrality is included in target 15.3 of the United Nations (UN) Sustainable Development Goals for 2030 (SDGs) and land use information underpins several other targets, e.g. SDG target 11.3 on sustainable cities and SDG target 15.1 on conservation, restoration and sustainable use of ecosystems. Moreover, SDG target 15.9 addresses the integration of ecosystem and biodiversity values into accounting, among other things. More recently, the European Strategy for Environmental Accounts 2019-2023 describes priorities and actions for the use of environmental accounts in a harmonised way.
The EEA’s approach to environmental accounting uses geospatial data and respects the international standards for measuring the environment and its relationship with the economy, as set out in the UN System of Environmental Economic Accounting — Central Framework. A separate briefing describes EEA’s approach to developing ecosystem extent and condition accounts (EEA, 2020).
Data and methods for land accounts
Accounting is an economic term referring to the systematic process of communicating financial gains and losses (i.e. credit and debit). Land accounting therefore requires uniform and harmonised data on gains and losses in different land categories across the territorial extent in question. Such data come from the monitoring of land cover as seen from Earth observation instruments, such as satellites. Replacing economic assets in the accounts by land cover stocks means the shares of different land cover within spatial reporting units, and changes within them, can be quantified. Land cover changes can therefore be associated with socio-economic land use processes, and analysis of these changes enables us to evaluate pressures from land use change on the environment.
The EEA’s land accounting is based on the Copernicus CORINE Land Cover (CLC) datasets for the years 2000, 2006, 2012 and 2018. CLC status layers for a given reference year (e.g. 2018) use mapping units of 25 hectares (ha), but CLC change datasets (e.g. from 2012 to 2018) capture changes at 5 ha. Therefore, simply subtracting one data set from another does not produce the CLC change dataset. In order to solve this, land cover accounting layers are created to produce a harmonised time series for the whole period 2000-2018 (ETC/ULS 2020).
The CLC data set has 44 classes and the number of potential unique land cover changes between two observation periods is large (i.e. 44*43 = 1 892). Grouping them into change categories known as Land Cover Flows (LCFs) provides transparent assessments, since the flow statistics between individual CLC classes or groupings give important insights into the nature of land cover change processes. LCFs are defined using three hierarchies that describe different land cover or land use change processes. Of these, level 1 is the most aggregated, containing nine LCF types (EEA, 2006).
The EEA’s Integrated Data Platform (ETC/ULS, 2020) is made up of geospatial data architecture and IT system infrastructure to enable the consistent and systematic production of land and ecosystem accounts. In detail, the Spatial Data Infrastructure organises and catalogues geospatial data with an interactive interface. The thematic node Environmental Accounting Reference Layers (EARL) assembles harmonised and quality assured datasets. Interactive dashboards enable the exploration of geospatial datasets that describe our natural capital.
The IT infrastructure of the IDP contains the Joint Environmental Data Infrastructure (JEDI, ETC/ULS, 2020), which uses cloud infrastructure to transfer geospatial data into tabular formats (dimensions). Using data cubes, the dimensions of land cover datasets may be integrated with other dimensions, such as administrative boundaries, biogeographical regions or bio-physical and socio-economic data. For the integration, uniform reference grids are used with 1 km x 1 km and 100 m x 100 m cells as the accounting units, following INSPIRE directive specifications.
A data cube allows for user driven queries and gives tabular, chart or map results. The EEA’s own interactive dashboard for land accounts (EEA 2019c) displays the land stock and changes to it, detailing statistics by year and by geographical unit (Box 1). Moreover, the data cube allows for the efficient combination of various categories of a dimension (e.g. arable lands and permanent crops) or combinations of dimensions aggregated in grids or administrative boundaries.
Box 1. Land cover change interactive dashboard
The EEA’s land cover change interactive dashboard enables land cover stocks accounting in Europe. It can be broken down by country and includes various selection choices: year of observation, classification hierarchy and breakdown by administrative or biogeographical region. By changing settings, the tables and charts change accordingly to display the chosen statistics. The ‘Accounting for land cover changes’ tab of the interactive dashboard provides assessments for the drivers of land cover change. Selecting LCF level 1 for the EEA-39 countries, for example, shows that in the period 2000-2018, 24 388 km2 of arable lands were transformed to some other land cover (i.e. Consumption), whereas 17 160 km2 of arable lands were added to the existing arable land stock (Formation). The difference in these values indicates that arable land decreased by 7 228 km2. The rows of the table break these changes down to the various LCF categories. This allows us to analyse the causes of losses and gains in arable land cover. For instance, the largest share of arable land consumption (6 222km2) happened because of growth in economic sites and infrastructure.
Accounting for major land use processes: example on land take and sealing
Figure 1. Land converted to urban areas in the EEA-39, 2000-2018
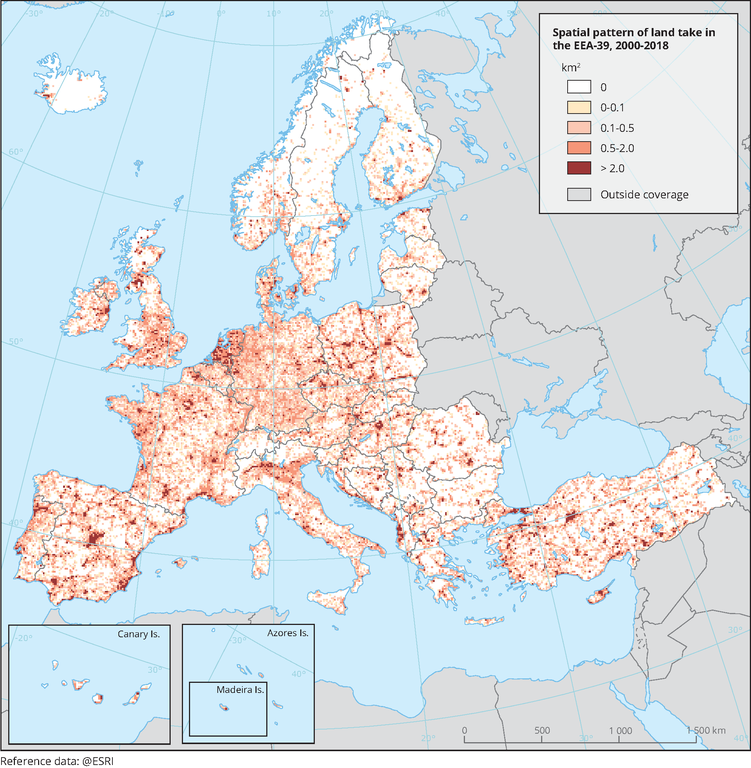
Land take occurs when urban areas and sealed surfaces expand at the cost of more natural land cover types (EEA, 2019a), reducing the potential of the land to perform various functions and crucial ecosystem services (EEA, 2019b). The major factors behind land take in the EEA-39 region are industrial and commercial activities, and residential sprawl (EEA, 2019a) concentrated around larger urban agglomerations (Figure 1). In the EEA-39 in the period 2000-2018, 14 049 km2 was urbanised as indicated by the land take interactive dashboard, mostly at the expense of arable lands and permanent crops (around 50 % of the total urbanisation), and of pastures and mosaic farmlands (almost 30 %). Soil sealing — an extreme form of land take — covers lands with impermeable surfaces, resulting in a decline in land functions. Both land take and soil sealing have slowed down, although sealing less so: 1.7 % more of the land area was sealed in the period 2012-2015 (compared with an increase of 2.4 % in sealing between 2006 and 2009 in the EEA-39 region (see the soil sealing dashboard).
Land recycling — the reuse of abandoned, vacant or underused land for redevelopment (EEA, 2018) — is still low in all European countries: on average, land recycling accounted for only 13.5 % of total land consumption in European cities in the period 2006-2012 (see land recycling dashboard). The largest component of land recycling is densification, i.e. when new urban development makes maximum use of urban space and existing infrastructure.
Accounting for major land use types: example on agriculture and forestry
Figure 2. Arable land and permanent crop land cover change, 2000-2018
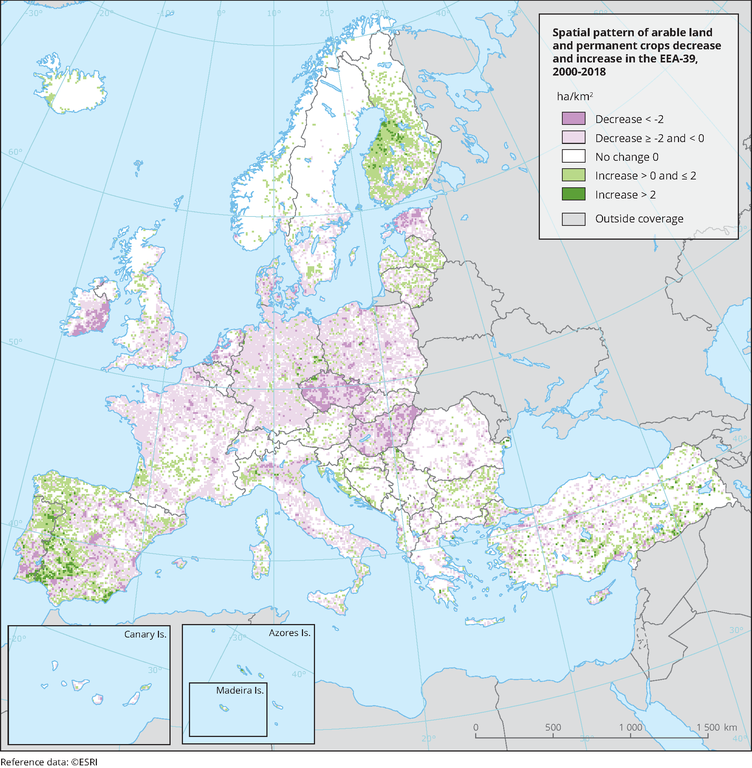
The area of arable land and permanent crops, a key component of CLC agricultural classes, has decreased in EEA39 by 7227km2 between 2000 and 2018 (land accounts). This is 0.5% decrease in the entire EEA-39 region with localised pattern (Figure 2): largest decreases in the range of 10-15 ha/km2 were seen in Czechia, Hungary, the central part of Spain, southern Portugal, as well as in Ireland and Estonia. The largest increases in the 5-15 ha/km2 range were observed in eastern Portugal, the south-western part of Spain and in central Finland. Figure 3 describes the share of various specific land cover changes contributing to losses of arable land and permanent crops. While in Hungary and Portugal the main driver was an increase in the forest and woodland area, in many other countries the main driver was the growth in economic sites and infrastructure.
Figure 3. Share of land cover changes contributing to loss of arable land and permanent crops in the EEA-39, 2000-2018.
The extent of forest areas in Europe is rather stable. During the accounting period 2000-2018, the forest area in the EEA-39 region grew by only 0.003 %, or 70 km2 (land accounts) Forest land cover change presented a regional pattern during the period 2000-2018, although this is a rather short period in terms of the full forest management cycle. There are clusters in eastern Europe, Ireland and southern Scotland, as well as in the Iberian Peninsula (Figure 4) where the extent of forest land cover is increasing. A decrease in forest land cover was observed in Finland and in the Mediterranean, for example in Greece, Croatia, Italy, Spain and Portugal (up to 15 ha/km2). Figure 5 presents the main factors behind local decreases in forest land cover. In Portugal and Spain, the dominant drivers of this decrease are forest fires and the conversion of forested areas to agricultural land. In Turkey, on the other hand, the spread of built up areas, such as economic sites and infrastructure, have driven local decreases in forest land cover.
Figure 4. Forest land cover decrease and increase in the EEA-39, 2000-2018
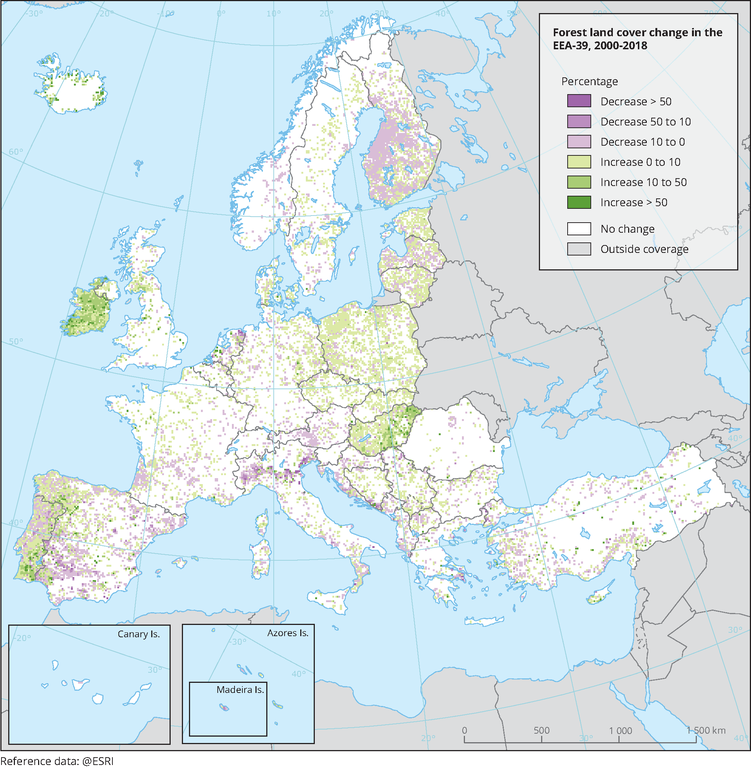
Figure 5. Share of land cover changes contributing to loss of forested area in EEA-39, 2000-2018
Summary and outlook
The methods for land accounting described in this briefing will be further extended to other environmental topics for general geospatial environmental accounting. This will be facilitated by the Integrated Data Platform for the integration of diverse geospatial datasets. The methods are flexible and may be applied to any categorical geospatial data, while statistics can be broken down to any reference region, e.g. administrative NUTS units, river basins, floodplains (floodplains dashboard) or Natura 2000 areas (Natura2000 dashboard).
With the increasing number of Earth Observation products and their higher spatial and temporal resolution, improved capacity for big data processing is becoming a must. To provide policy support, the management and processing of such datasets must follow state-of-the-art standards and become automated, efficient and up-to-date. The EEA will further develop its geospatial environmental accounting system addressing big data cubes with regularly datasets from the Copernicus Land Monitoring Service.
Briefing no. 12/2020
Title: Land cover accounts — an approach to geospatial environmental accounting
PDF - TH-AM-20-003-EN-N - ISBN 978-92-9480-226-2 - ISSN 2467-3196 - doi: 10.2800/444996
HTML - TH-AM-20-003-EN-Q - ISBN 978-92-9480-225-5 - ISSN 2467-3196 - doi: 10.2800/446959
The withdrawal of the United Kingdom from the European Union did not affect the production of this briefing. Data reported by the United Kingdom are included in all analyses and assessments contained herein, unless otherwise indicated.
- Other land recycling processes: grey recycling — internal conversion between residential and/or non-residential land cover types — accounts for 3.2 % of total land consumption; green recycling — the development of green urban areas using previously built-up areas — is an important trend that reverses soil sealing, but it is a marginal process in all countries and, on average, it accounts for only 0.2 % of total land consumption.
EEA, 2006, Land accounts for Europe 1990-2000 — towards integrated land and ecosystem accounting, EEA Report No 11/2006, European Environment Agency, accessed 2 March 2014.
EEA, 2018, Land recycling and densification (LSI 008), European Environment Agency, accessed 29 May 2019.
EEA, 2019a, Land take in Europe (CSI 014/LSI 001), European Environment Agency, accessed 28 August 2019.
EEA, 2019b, The European environment — state and outlook 2020: knowledge for transition to a sustainable Europe, European Environment Agency, accessed 9 December 2019.
EEA, 2020, ‘Measuring the extent and condition of European ecosystems’, European Environment Agency, forthcoming.
ETC/ULS, 2020, Land and ecosystem accounts for Europe. Towards geospatial environmental accounting, European Topic Centre on Urban, land and soil systems, accessed 16 October 2020
Related content
- Measuring the extent and condition of European ecosystems
- Developing accounting methods for land cover changes