All official European Union website addresses are in the europa.eu domain.
See all EU institutions and bodiesAn official website of the European Union | How do you know?
Environmental information systems
EN
Maps and charts from Europe's environment 2025

The figure shows the EU gross available energy consumption in 2022.
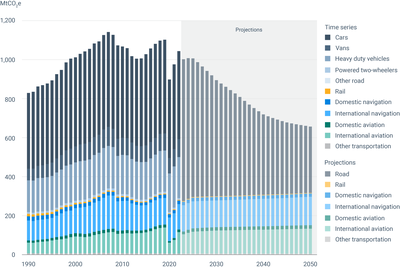
This figure shows direct EU-27 GHG emissions trends reported by Member States for different modes of transport, including emissions from international bunkers. It includes the reported emissions from 1990 to 2022, and the projections until 2050.
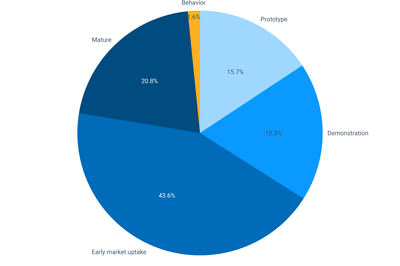
This figure produced by the IEA shows global energy sector CO 2 emissions reductions by 2050 in IEA NZE Scenario, enabled by technologies according to their respective technology readiness levels as of 2022.
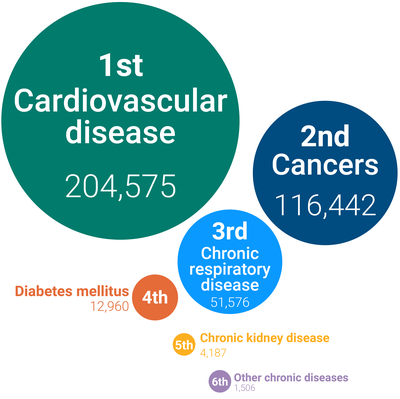
This is an infographic that allows the user to see the life lost or premature deaths and shows the number of deaths or YLL for each releated non-communicable disease.
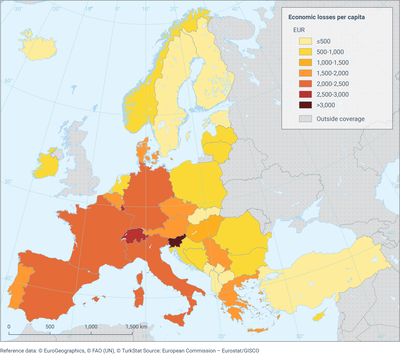
This figure displays the economic losses per capita in each country, aggregated for 1980-2023 and all weather- and climate-related event types. Economic losses per capita are in Euros (EUR). Detailed information on the procedure used to derive economic losses is reported in Box 1.
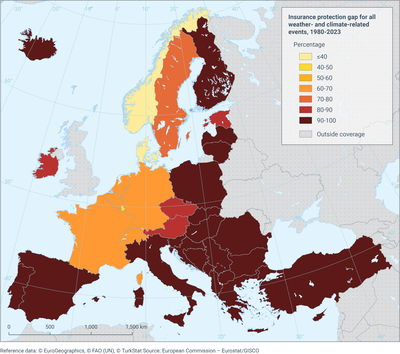
This figure displays the insurance protection gap in each country, aggregated for 1980-2023 and all weather- and climate-related event types. The insurance protection gap is in percentage terms (%). Detailed information on the procedure used to derive economic losses and the insurance protection gap is reported in Box 1.

The figure shows the results of 2,825 conservation status assessments of animal and plant species (left) and 818 conservation status assessments of habitats (right) and covered by the Habitats Directive.