All official European Union website addresses are in the europa.eu domain.
See all EU institutions and bodiesAn official website of the European Union | How do you know?
Environmental information systems
EN
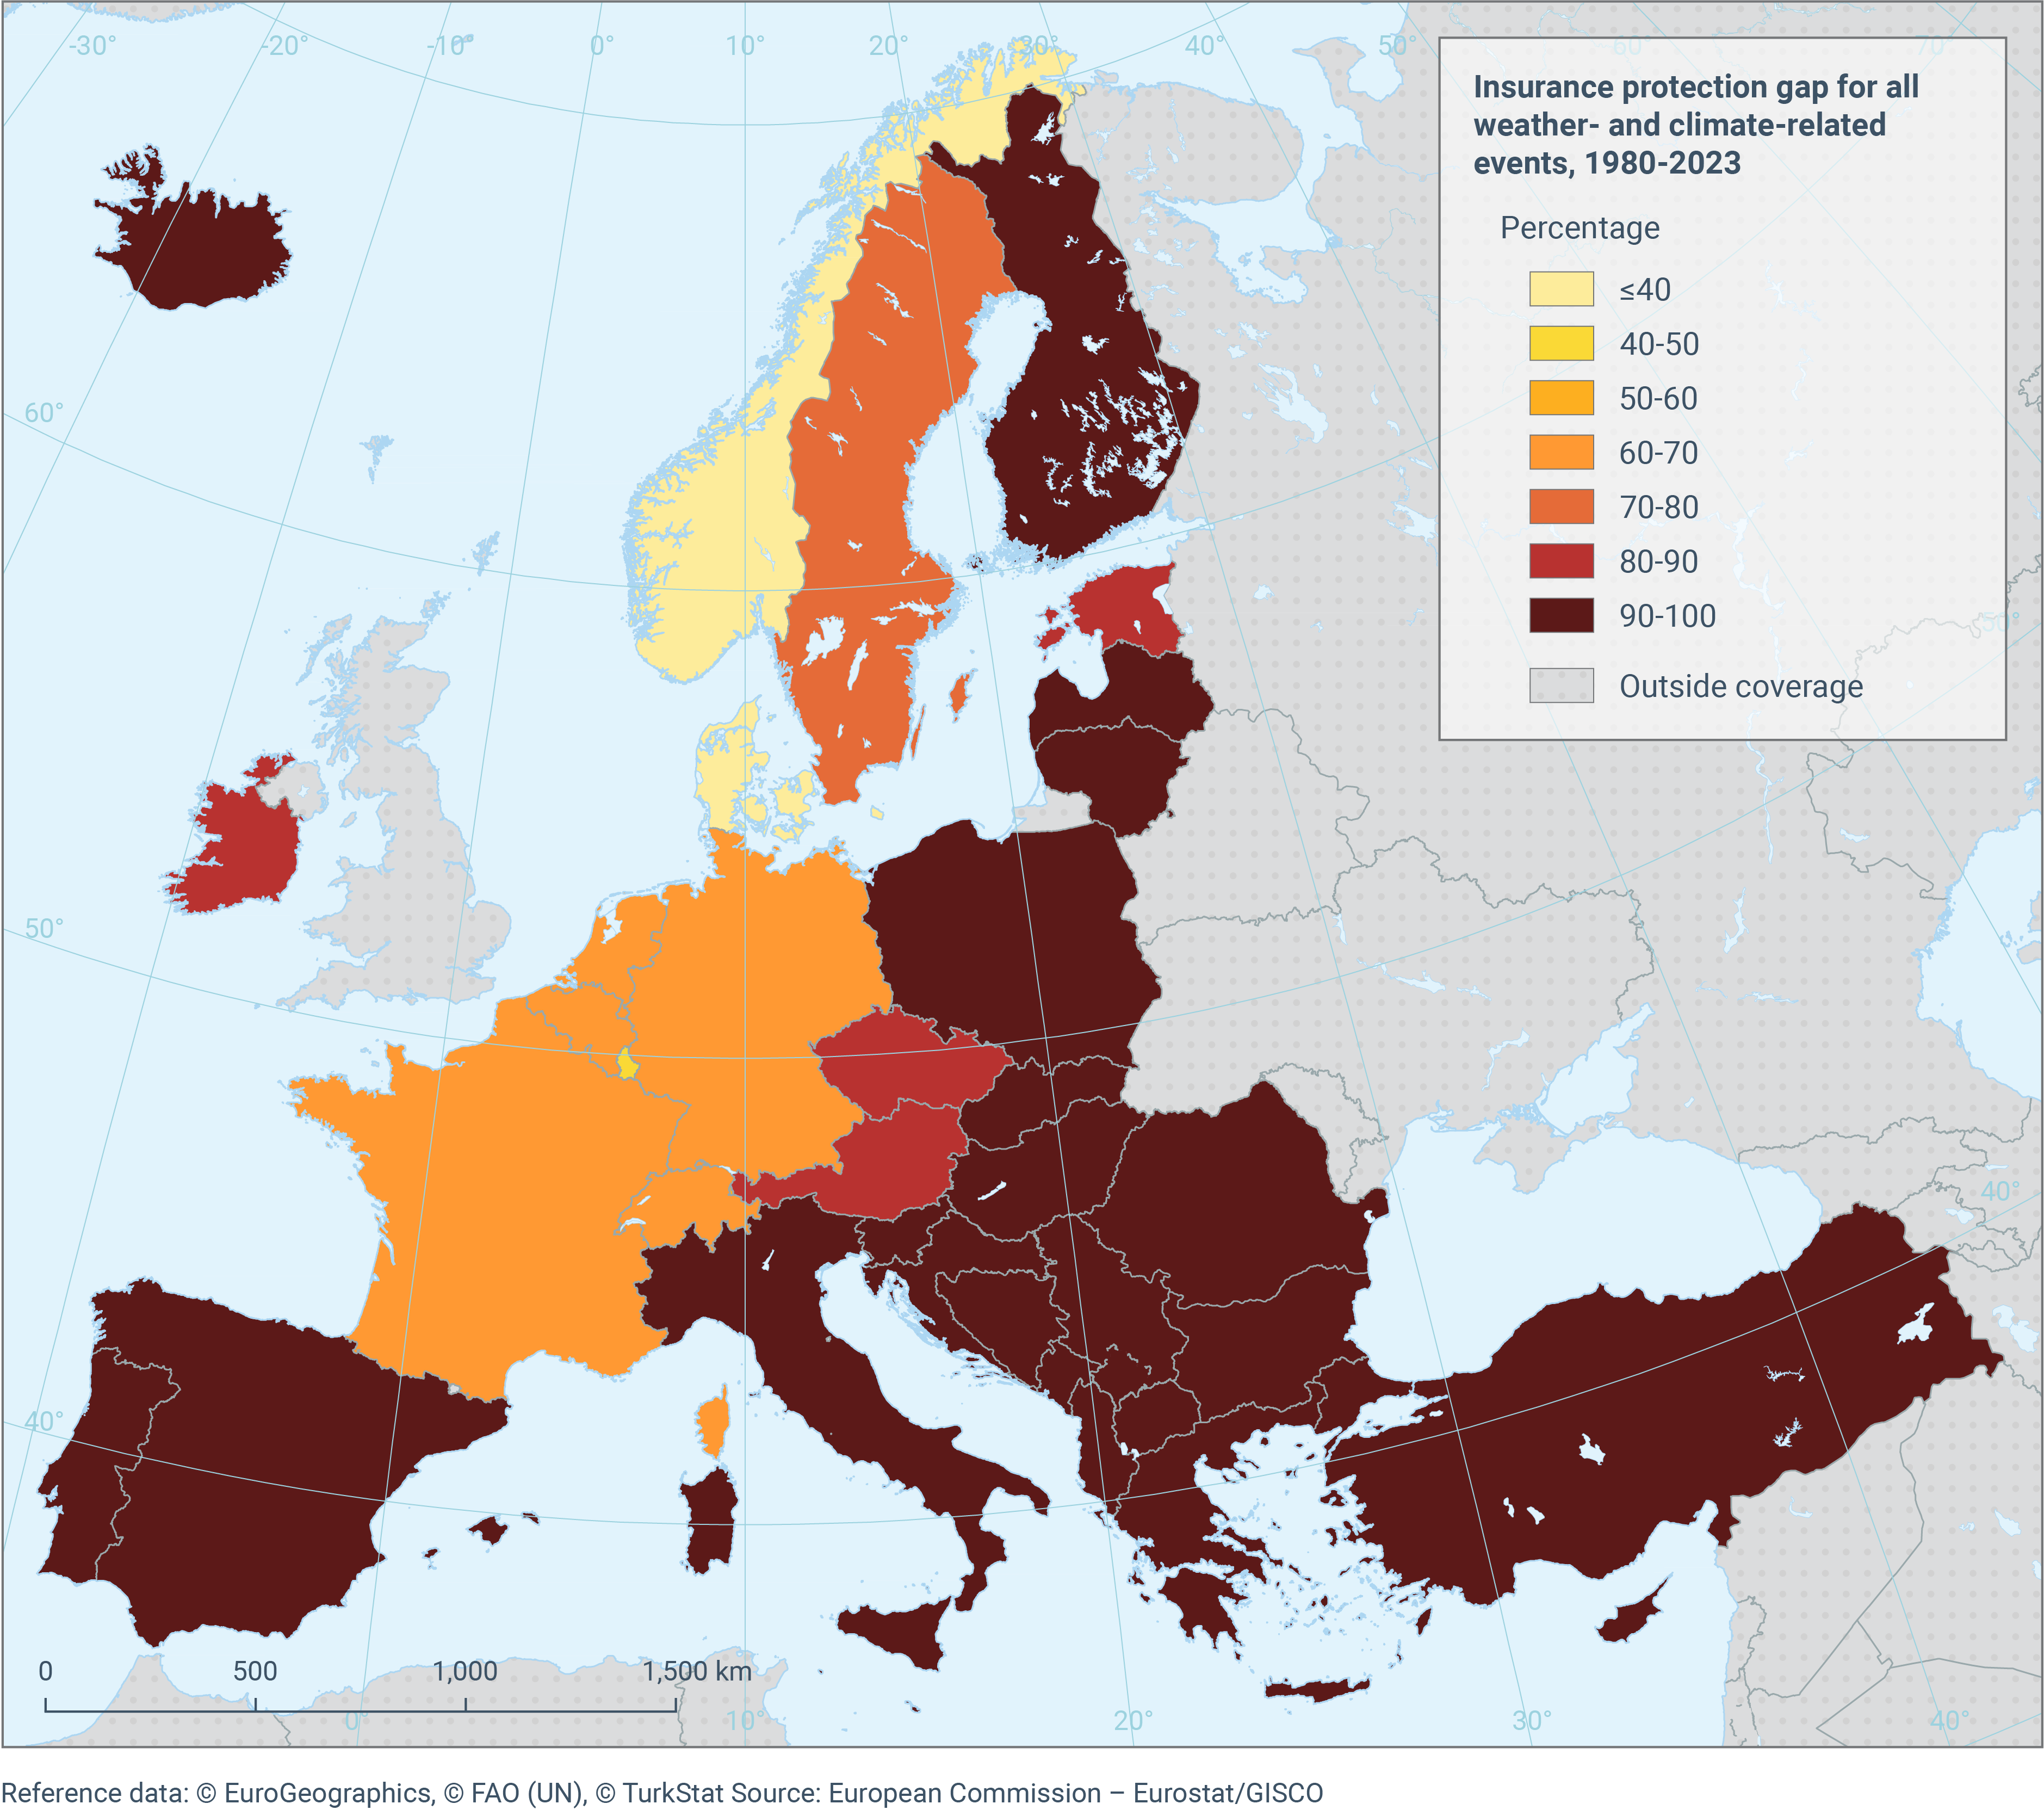
This figure displays the insurance protection gap in each country, aggregated for 1980-2023 and all weather- and climate-related event types. The insurance protection gap is in percentage terms (%). Detailed information on the procedure used to derive economic losses and the insurance protection gap is reported in Box 1.
Map package.zip
Loading