All official European Union website addresses are in the europa.eu domain.
See all EU institutions and bodiesAn official website of the European Union | How do you know?
Environmental information systems
EN
What is the level of air pollution in your city? Stockholm, Reykjavik and Helsinki rank as the cleanest European capital cities in terms of air quality in the updated European Environment Agency’s (EEA) European city air quality viewer published today.
City air quality viewer
Users can check out how well their city is doing in the online European city air quality viewer, which has an updated methodology on how the rankings are calculated. Cities are ranked from the cleanest city to the most polluted, based on the risk of mortality associated with long-term exposure to fine particulate matter, (or PM2.5), nitrogen dioxide (NO2) and ozone (O3) over the past two calendar years.
This tool is focused on long-term air quality, as long-term exposure to air pollution causes the most serious health effects. The viewer is updated once a year. A new feature also allows easier comparison between the capital cities of each country.
European Air Quality Index
The EEA has also updated the European Air Quality Index. Users of the web-based index can now access more real-time information on air pollution levels with broader coverage as of today.
The updated service gives Europeans an even more accurate picture of the air quality around them, based on hourly data updates on concentrations of key air pollutants from more than 3,500 monitoring stations across Europe.
Hourly data is now used for all key pollutants to estimate the index, including particulate matter pollutants (PM2.5 and PM10), which were presented until now as 24-hour averages. The index presents the potential impact of short-term exposure to air pollution on health, with the index bands now updated to take into account the 2021 World Health Organization’s air quality guidelines.
The index is determined using a combination of up-to-date data reported by EEA member countries and forecasts of the air quality level as provided by the EU’s Copernicus Atmospheric Monitoring Service (CAMS). It also includes modelled data where information can be found for every single 1x1 km grid in Europe, in addition to the points where the monitoring stations are located.
Background
The European city air quality viewer has been published since 2019. Until now, cities were ranked only based on average concentration levels of fine particulate matter from urban or suburban background or traffic air quality monitoring stations. This limited the number of cities included to around 372, given the dependency on the stations. Furthermore, only fine particulate matter was used, excluding two other key pollutants and thereby preventing a more comprehensive comparison of air quality in cities, as is now delivered in the updated version.
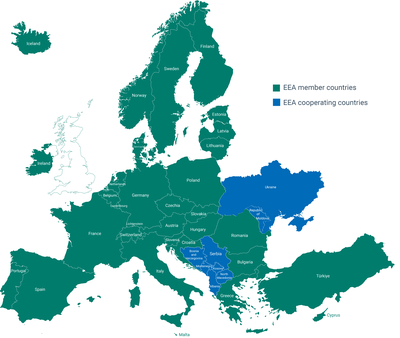
The European Air Quality Index was launched in 2017 and helps users to understand more about local air pollution and its impact on their health. The Index is operated by the EEA and based on reported data provided by member countries, cooperating countries and other voluntary reporting countries. Forecast air quality levels are provided by the Copernicus Atmospheric Monitoring Service.
Further information on the updated methodology can be found in the ETC HE Report 2024/17: EEA´s revision of the European air quality index bands'.
The mobile app can be downloaded for Android or iOS users.