All official European Union website addresses are in the europa.eu domain.
See all EU institutions and bodiesAn official website of the European Union | How do you know?
Environmental information systems
EN
- БългарскиBG
- češtinaCS
- HrvatskiHR
- danskDA
- NederlandsNL
- ελληνικάEL
- EnglishEN
- eestiET
- SuomiFI
- FrançaisFR
- DeutschDE
- magyarHU
- ÍslenskaIS
- italianoIT
- LatviešuLV
- lietuviųLT
- MaltiMT
- NorskNO
- polskiPL
- PortuguêsPT
- RomânăRO
- slovenčinaSK
- SlovenščinaSL
- EspañolES
- SvenskaSV
- TürkçeTR
Annual mean sea surface temperature for European seas
Chart (static)
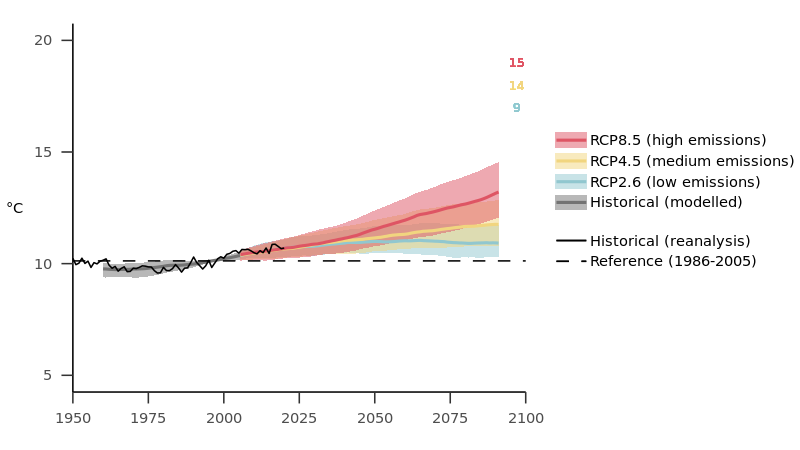
The black line shows the annual values for 1979-2018 from reanalysis data, and the dashed horizontal line shows the mean for 1986-2005. Solid grey, blue, yellow and red lines represent the ensemble median of model simulations for the historical period and under low-, medium- and high-emissions scenarios (RCP2.6, RCP4.5 and RCP8.5, respectively) (smoothed by a 20-year moving average). Shaded areas show the 15th and 85th percentile ranges of the model ensemble. The size of the model ensemble used for each scenario is shown by the coloured numbers in the top-right corner. European seas include all sea surfaces within 25 °W-50 °E and 34 °N-75 °N.
Downloads
Data sources
Metadata
More info
Loading
- ERA5 and bias-adjusted CMIP5 data.