Trends in NO₂ concentrations at monitoring stations in the port and the city of Antwerpen
Map (static)
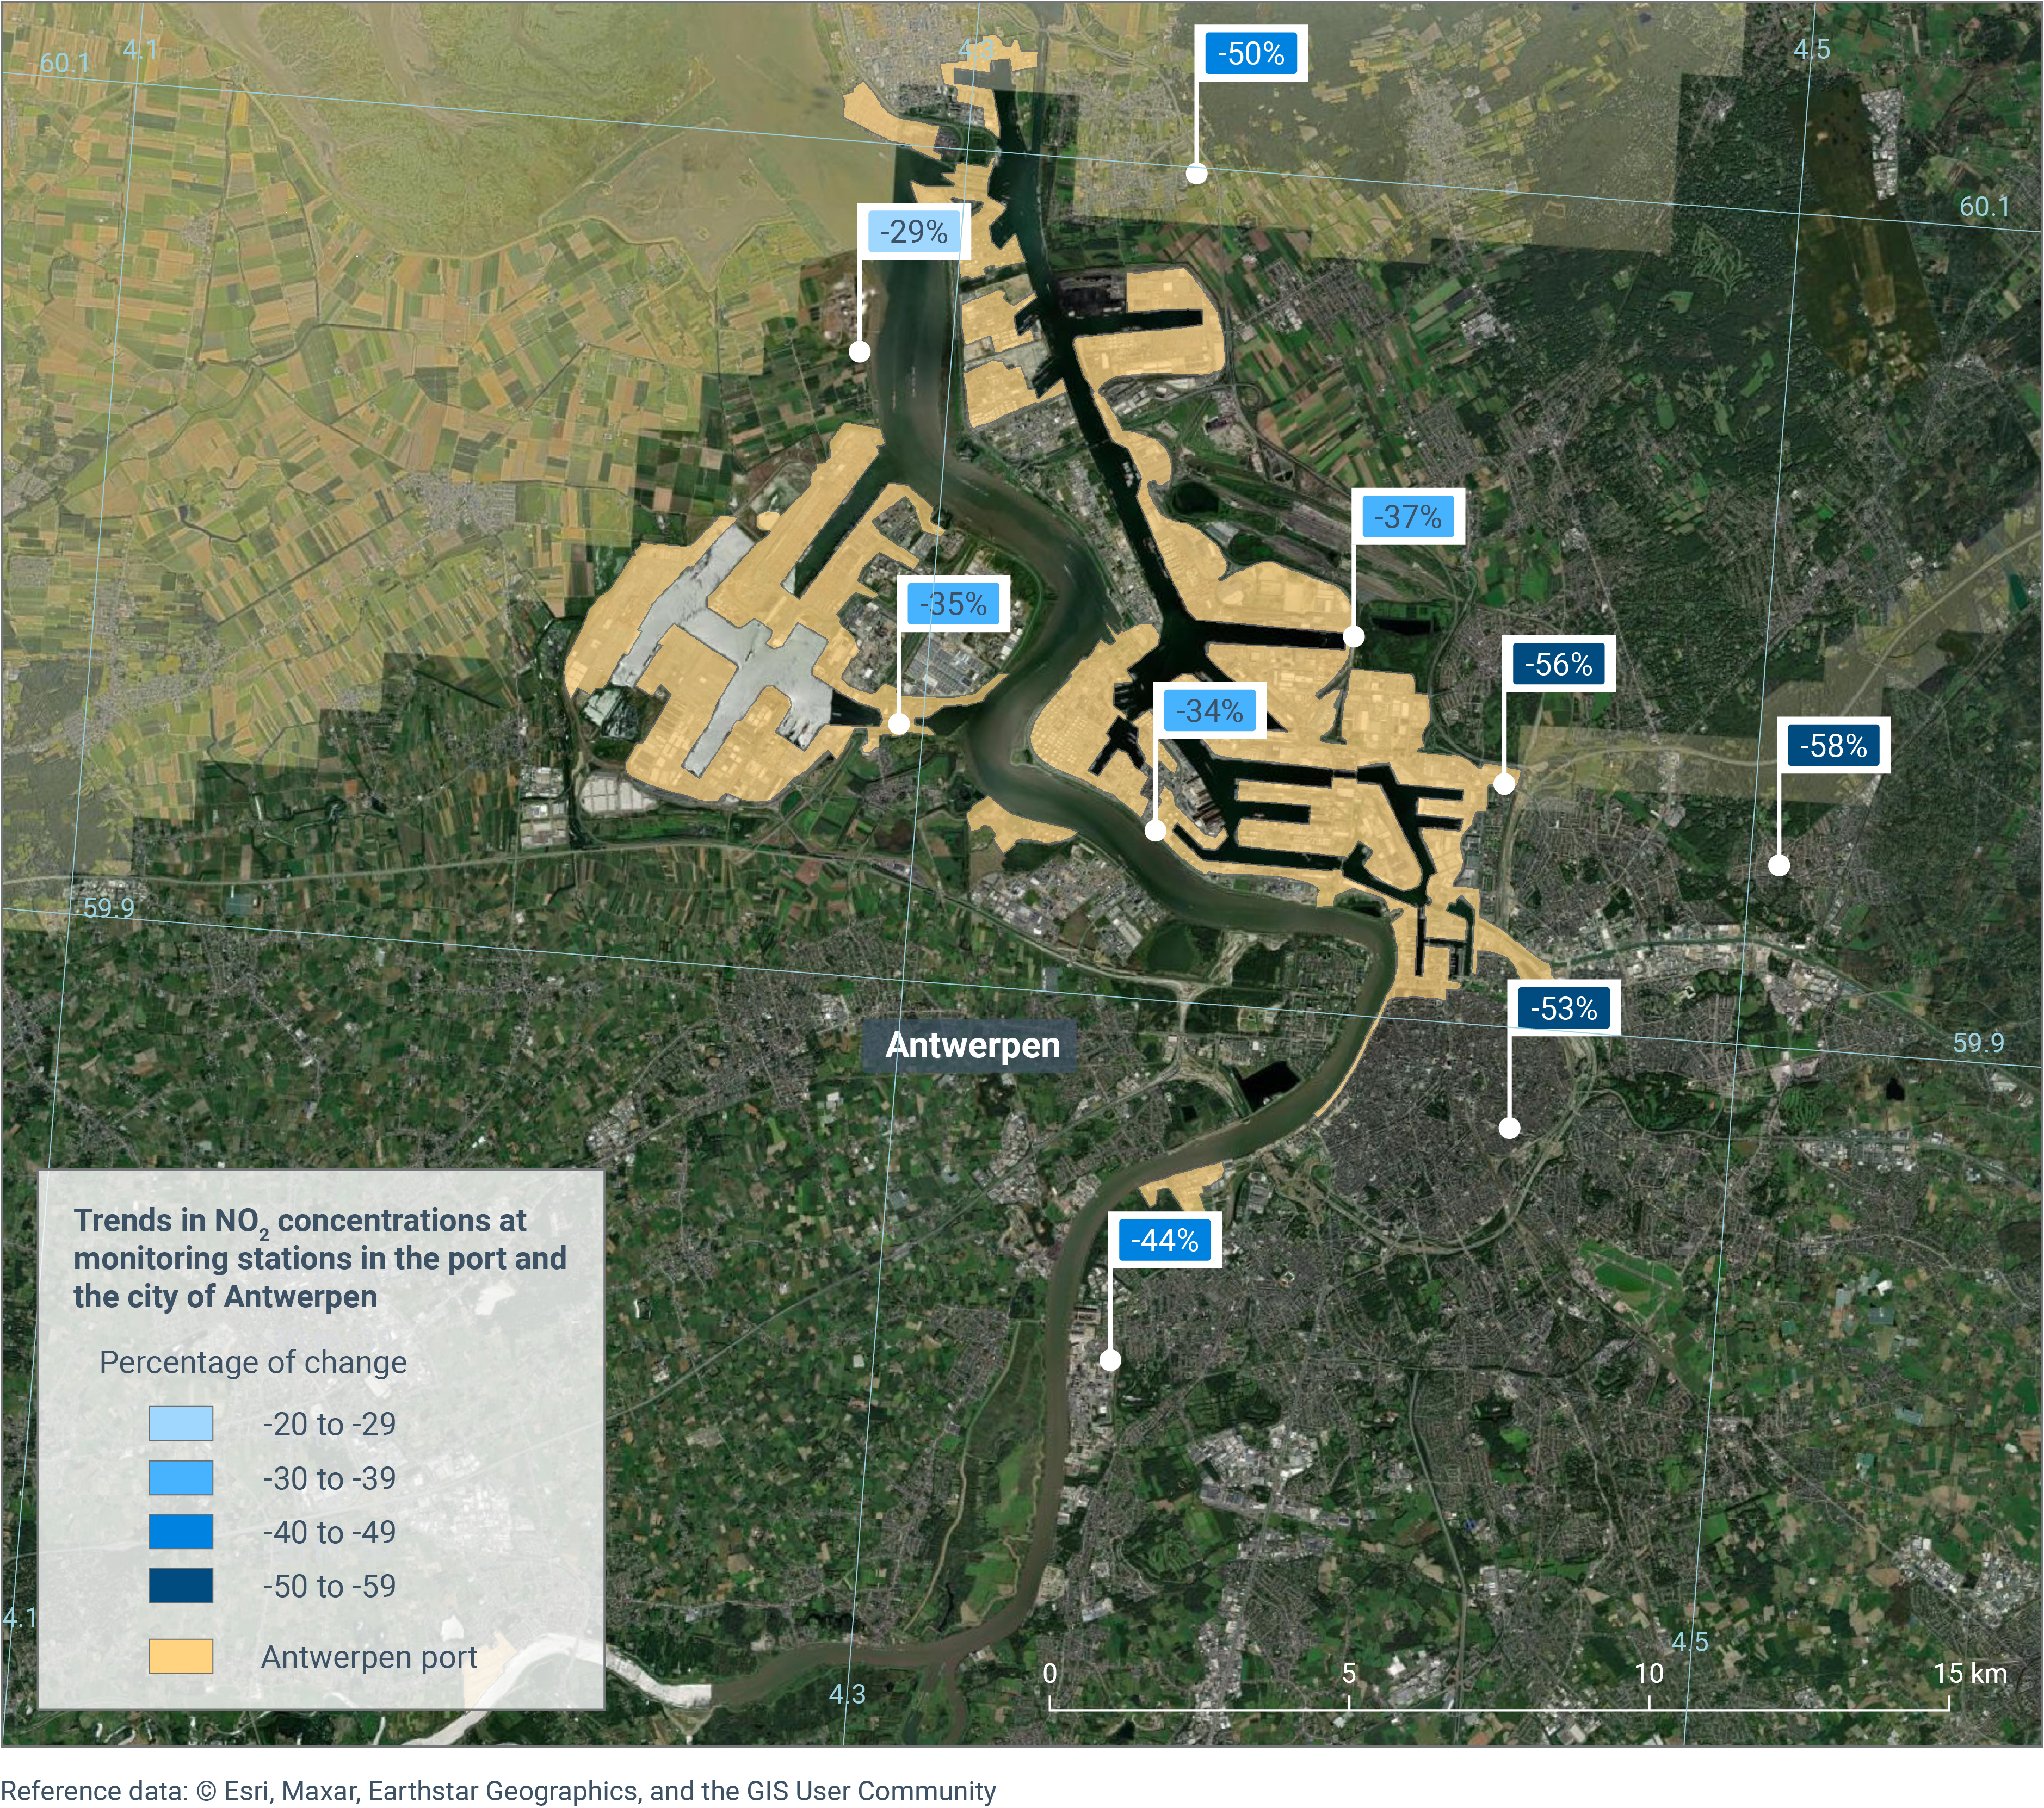
The map shows trends in NO2 concentrations at monitoring stations (in percentage of reduction) in the port and the city of Antwerpen from 2005 to 2023.
European Environment AgencyInstitut National de l'Environnement industriel et des RISques, INERIS
Units
Percentage of change
Methodology
This analysis is based on the European Air Quality data from EEA database (AIRBASE pre-2012 and Air Quality e-reporting post 2013) using validated data only. Monitoring stations are categorized by location (urban/suburban/rural) and type, with background stations analysed by area and traffic/industrial stations grouped separately. There is no outlier filtering applied but a completeness requirement of at least 75% data availability per year and more than 75% of years over the 19-year period is requested. Trend is calculated based on the Mann-Kendall test (p<0.05) with Sen-Teil slope estimation. Relative changes are estimated using 2005 baseline to minimize interannual variability effects.