All official European Union website addresses are in the europa.eu domain.
See all EU institutions and bodiesAn official website of the European Union | How do you know?
Environmental information systems
EN
- БългарскиBG
- češtinaCS
- HrvatskiHR
- danskDA
- NederlandsNL
- ελληνικάEL
- EnglishEN
- eestiET
- SuomiFI
- FrançaisFR
- DeutschDE
- magyarHU
- ÍslenskaIS
- italianoIT
- LatviešuLV
- lietuviųLT
- MaltiMT
- NorskNO
- polskiPL
- PortuguêsPT
- RomânăRO
- slovenčinaSK
- SlovenščinaSL
- EspañolES
- SvenskaSV
- TürkçeTR
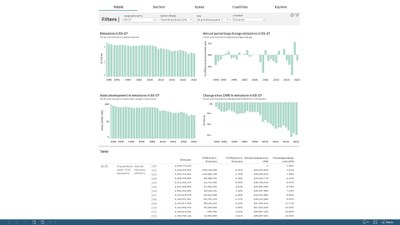
Ozone precursors emission trends in EU-27 from 2005 to 2023 and emission shares per country in 2023
Chart (interactive)
The chart presents trends in CH4, NMVOC, and NOx emissions in the EU‑27 from 2005 to 2023, and displays each Member State’s contribution to the EU total for these three ozone precursors.

kt: kilotonnes
Assessment
Data sources
Metadata
More info
- Total GHG emissions and removals in the EU, European Environment Agency (EEA)
- National Emission reductions Commitments (NEC) Directive emission inventory data, 1980-2023 ver 2.0, European Environment Agency (EEA)
- Austria
- Italy
- Belgium
- Latvia
- Bulgaria
- Lithuania
- Croatia
- Luxembourg
- Cyprus
- Malta
- Czechia
- Netherlands
- Denmark
- Poland
- Estonia
- Portugal
- Finland
- Romania
- France
- Slovakia
- Germany
- Slovenia
- Greece
- Spain
- Hungary
- Sweden
- Ireland
2005-2023
Methodology
NOx and NMVOC have been directly used from the National air pollutant emissions data viewer 2005-2023 of the EEA. CH4 data is taken from the EEA greenhouse gases — data viewer, and amended to express the correct unit, as CH4 data is included in the dataviewer as tCO2eq, which requires dividing the data by 28 (GWP of CH4 according to the 5th IPCC Assessment Report) and by 1000 (to change from t to kt).