All official European Union website addresses are in the europa.eu domain.
See all EU institutions and bodiesAn official website of the European Union | How do you know?
Environmental information systems
EN
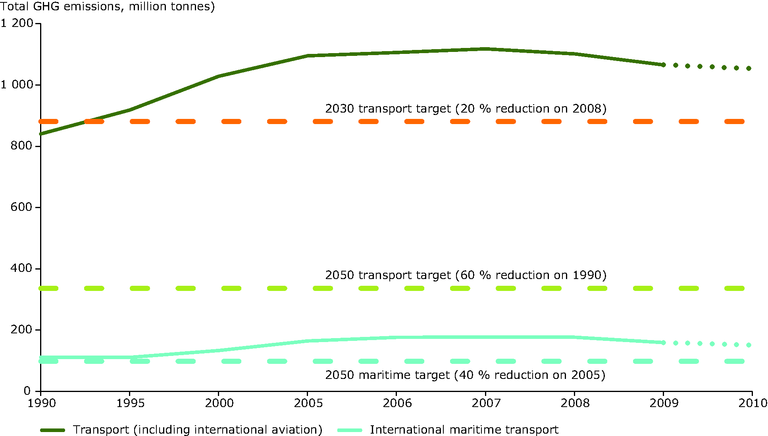
Graph with two lines showing total GHG emissions for transport (including intl. Aviation) and international maritime transport. 2030 and 2050 target reductions also shown as dotted lines.
Loading