All official European Union website addresses are in the europa.eu domain.
See all EU institutions and bodies- БългарскиBG
- češtinaCS
- HrvatskiHR
- danskDA
- NederlandsNL
- ελληνικάEL
- EnglishEN
- eestiET
- SuomiFI
- FrançaisFR
- DeutschDE
- magyarHU
- ÍslenskaIS
- italianoIT
- LatviešuLV
- lietuviųLT
- MaltiMT
- NorskNO
- polskiPL
- PortuguêsPT
- RomânăRO
- slovenčinaSK
- SlovenščinaSL
- EspañolES
- SvenskaSV
- TürkçeTR
Progress towards selected waste management targets
Chart (static)
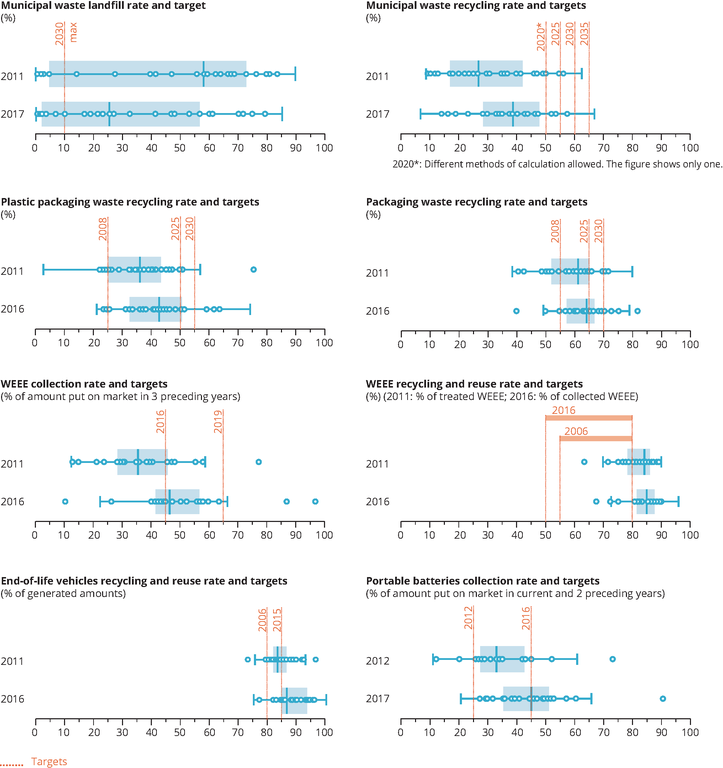
The figure shows the landfilling rate for municipal waste by country. Each dot represents a country. The boxes represent the upper and lower quartiles, and the line in the box shows the median.

- End-of-life vehicles - reuse, recycling and recovery, totals (env_waselvt)
- Sales and collection of portable batteries and accumulators (env_waspb)
- Waste Electrical and Electronic Equipment (WEEE)
- Municipal waste by waste management operations (env_wasmun)
- Austria
- Belgium
- Bulgaria
- Croatia
- Cyprus
- Czechia
- Denmark
- Estonia
- Finland
- France
- Germany
- Greece
- Hungary
- Iceland
- Ireland
- Italy
- Latvia
- Lithuania
- Luxembourg
- Malta
- Netherlands
- Norway
- Poland
- Portugal
- Romania
- Slovakia
- Slovenia
- Spain
- Sweden
- Switzerland
- United Kingdom
Methodology
Landfilling rate = (waste landfilled / waste generated) * 100
Recycling rate = (waste recycled / waste generated) * 100
Recycling rate = (waste recycled or reused / waste generated) * 100
Collection rate of WEEE: ( WEEE collected / average quantity of EEE put on the market in the previous three years) * 100
Recycling and reuse rate of total WEEE until 2013: (waste recycled and reused / waste treated) * 100
Recycling and reuse rate of total WEEE since 2014: (waste recycled and reused / waste collected) * 100
Collection of portable batteries and accumulators: (waste collected / the average weight placed on market in current and two preceding years) * 100