All official European Union website addresses are in the europa.eu domain.
See all EU institutions and bodiesAn official website of the European Union | How do you know?
Environmental information systems
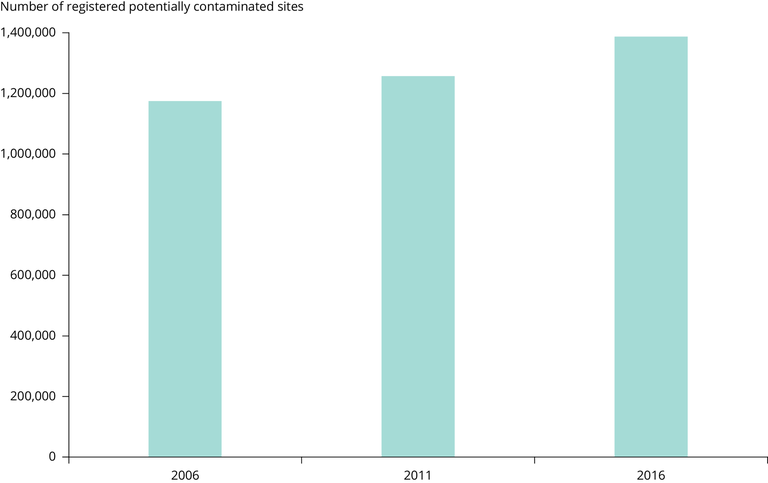
Potentially contaminated sites in the EU, as registered in national inventories
Chart (static)
The figure presents the trend in the number of registered potentially contaminated sites in 2006, 2011 and 2016.

Downloads
Data sources
Metadata
More info
Loading
- Austria
- Belgium
- Bulgaria
- Croatia
- Cyprus
- Czechia
- Denmark
- Estonia
- Finland
- France
- Germany
- Hungary
- Italy
- Latvia
- Lithuania
- Luxembourg
- Malta
- Netherlands
- Portugal
- Romania
- Slovakia
- Spain
- Sweden
2006
2011
2016
Methodology
EIONET questionnaires 2006, 2011, 2016 (Thematic Group Soil, Working Group Soil Contamination)
Additional information
The underlaying statistics for the 2016 questionnaire were reviewed in 2022 (EIONET)
23 countries reported in 2016, 18 in 2006. Since 2006, 6 new countries have contributed to the EEA indicator; one country omitted 2016. All new countries have only very initial national registers or inventories. The trend is largely explained by new sites which were detected and added to existing registers.
