All official European Union website addresses are in the europa.eu domain.
See all EU institutions and bodiesAn official website of the European Union | How do you know?
Environmental information systems
EN
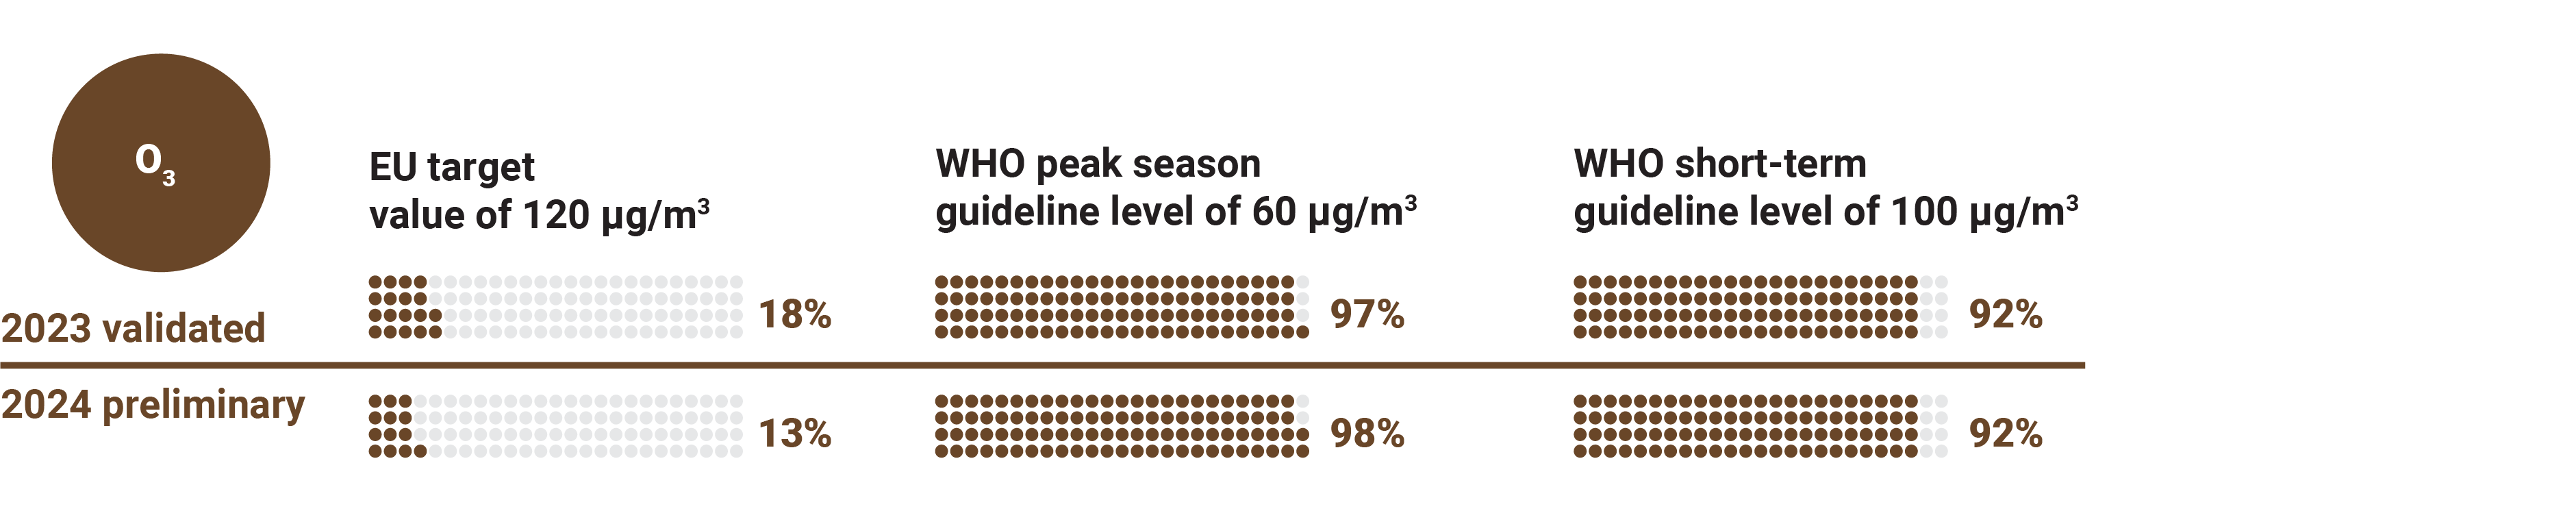
The figure shows the percentage of total reporting stations (with enough coverage data to be included in the web report) with concentrations above O3 EU target value threshold and WHO guideline levels