All official European Union website addresses are in the europa.eu domain.
See all EU institutions and bodiesAn official website of the European Union | How do you know?
Environmental information systems
EN
- БългарскиBG
- češtinaCS
- HrvatskiHR
- danskDA
- NederlandsNL
- ελληνικάEL
- EnglishEN
- eestiET
- SuomiFI
- FrançaisFR
- DeutschDE
- magyarHU
- ÍslenskaIS
- italianoIT
- LatviešuLV
- lietuviųLT
- MaltiMT
- NorskNO
- polskiPL
- PortuguêsPT
- RomânăRO
- slovenčinaSK
- SlovenščinaSL
- EspañolES
- SvenskaSV
- TürkçeTR
Percentage losses of potato yield due to O₃ exposure in 36 European countries in 2022
Map (static)
Potato yield losses at country level, expressed in percentage of yield loss, aggregated from the regional NUTS2 level losses.
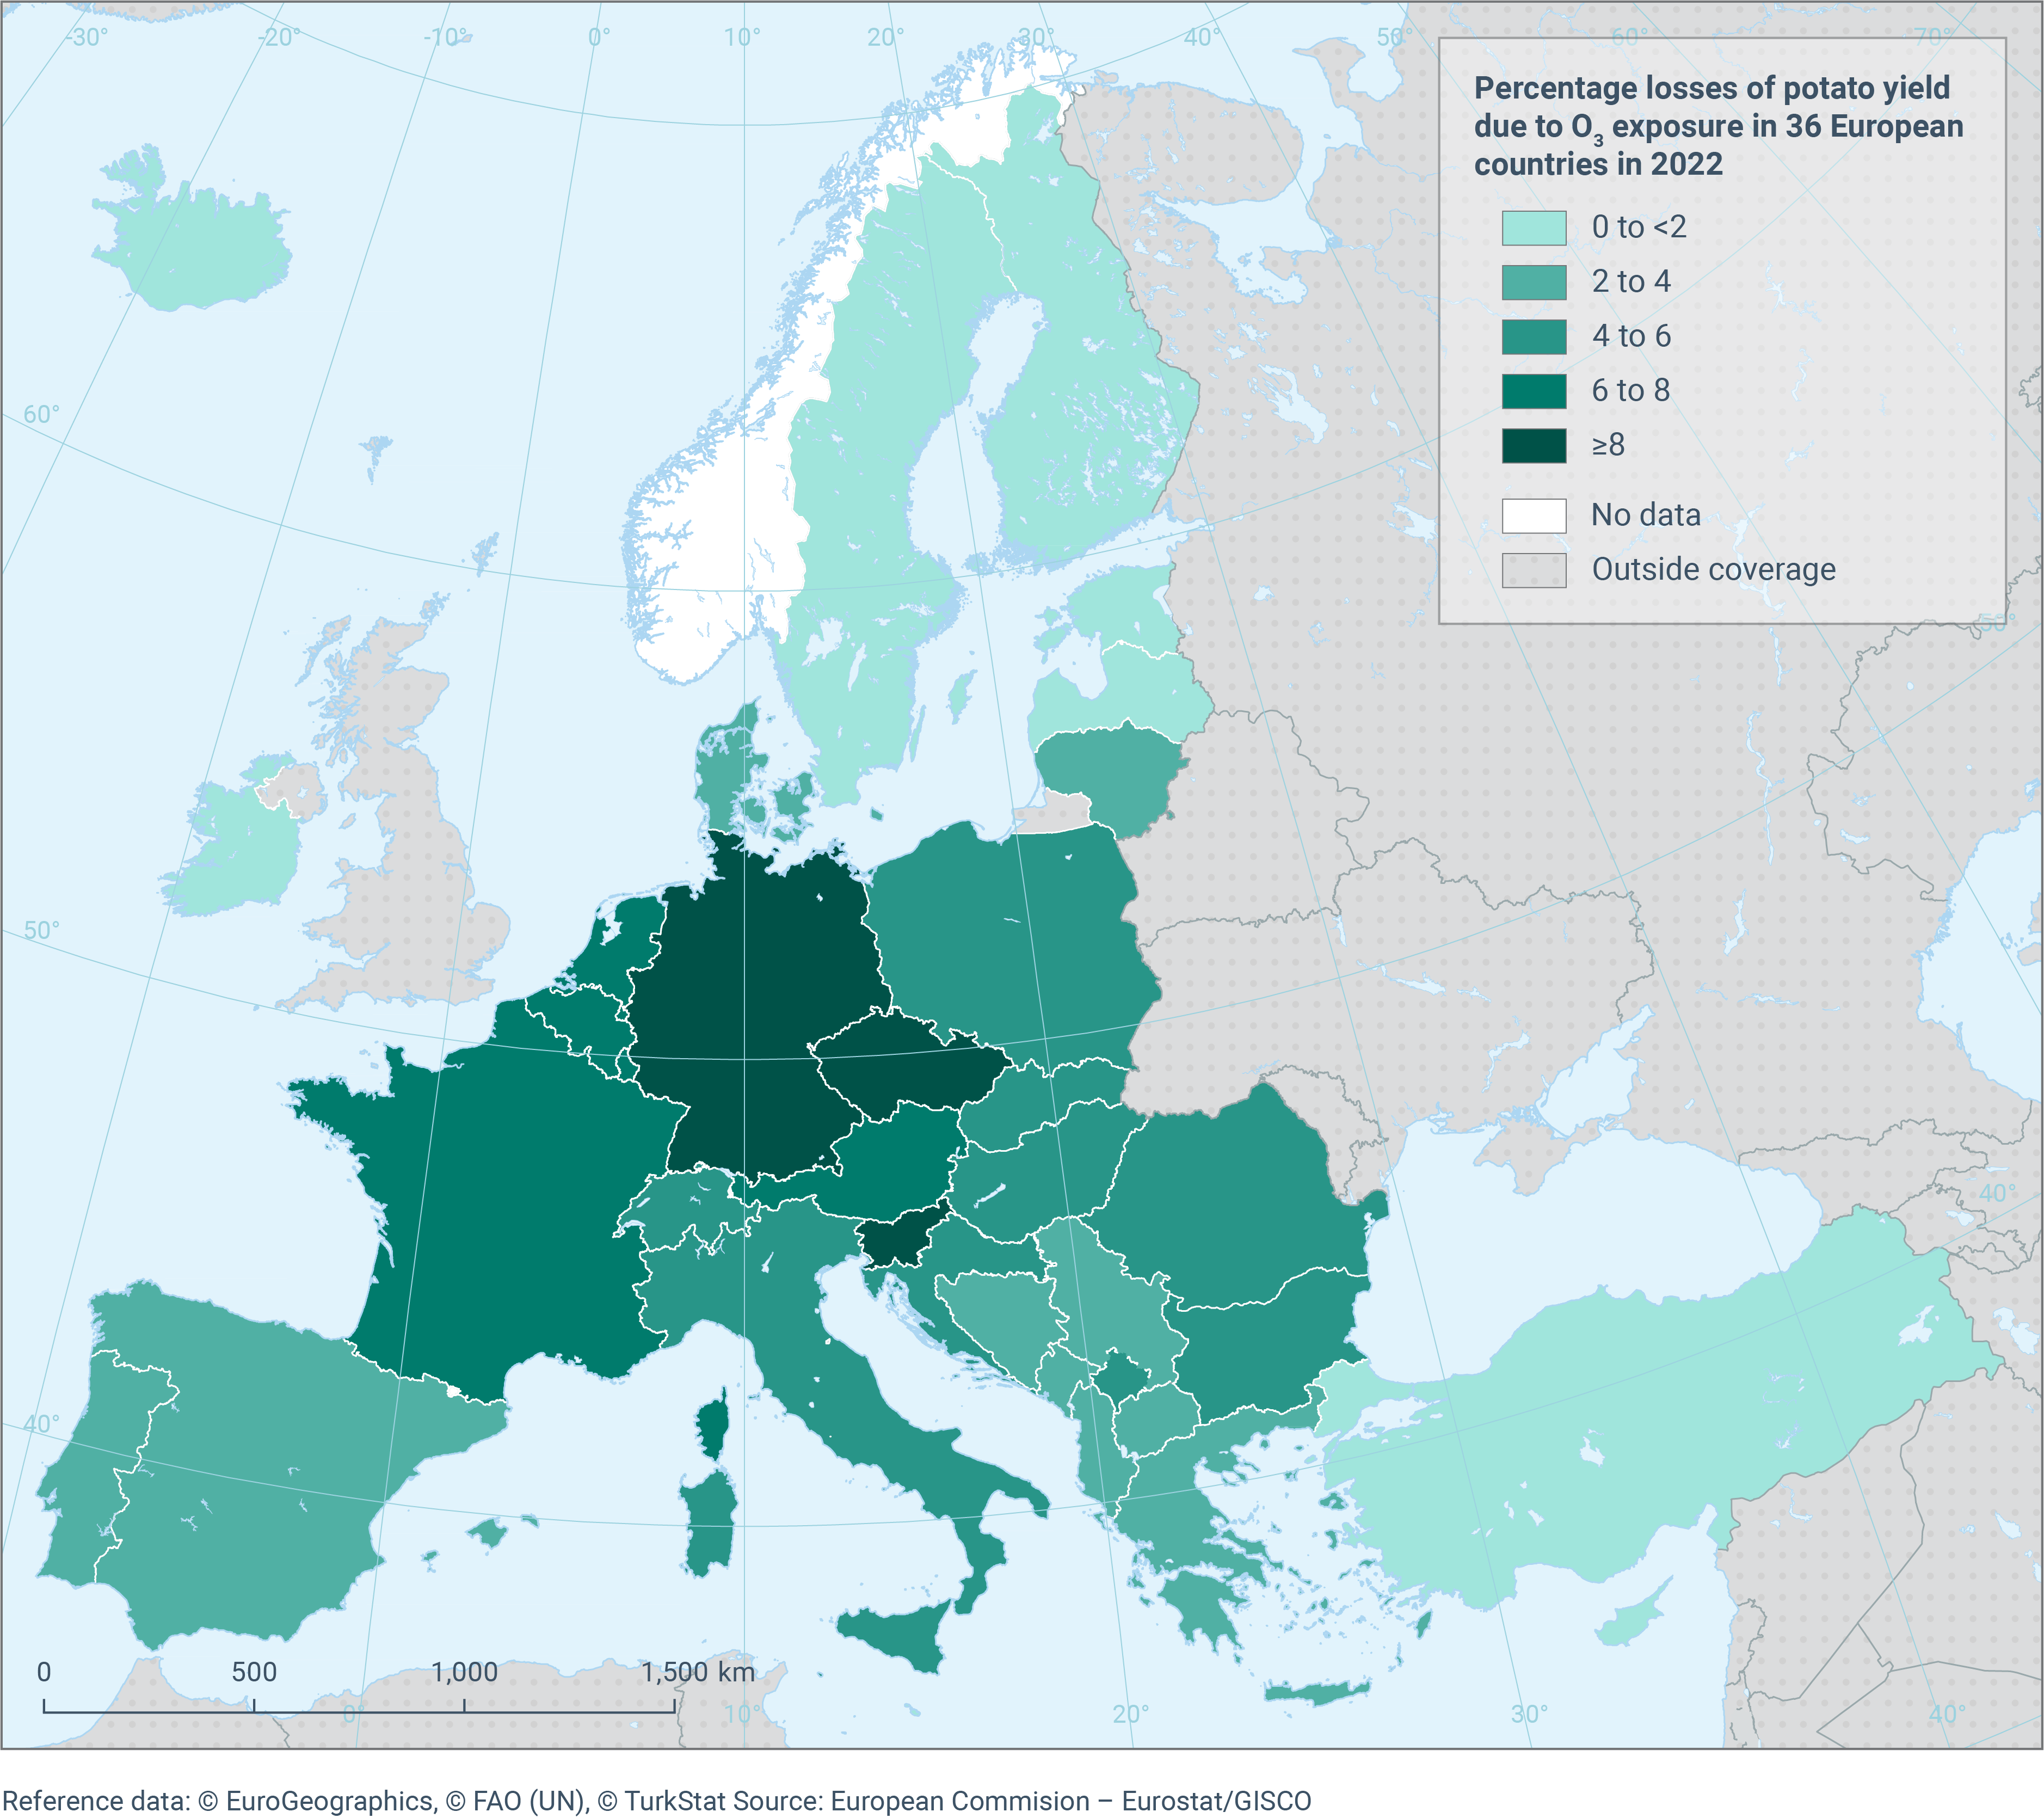
The map shows the percentage losses of potato yield due to O₃ exposure in 36 European countries in 2022, presented in percentage of yield loss, aggregated from the regional NUTS2 level.
Downloads
Data sources
Metadata
More info
Map-package.zip
Loading
- Cyprus
- Portugal
- Spain
- Malta
- Denmark
- Iceland
- Switzerland
- Sweden
- Netherlands
- Austria
- Belgium
- Germany
- Luxembourg
- Ireland
- Türkiye
- France
- Liechtenstein
- Slovakia
- Czechia
- Norway
- Italy
- Slovenia
- Montenegro
- Croatia
- Bosnia and Herzegovina
- Greece
- Estonia
- Latvia
- Lithuania
- Serbia
- Finland
- North Macedonia
- Hungary
- Bulgaria
- Albania
- Poland
- Romania
- Kosovo (UNSCR 1244/99)
- Principality of Monaco
- Principality of Andorra
- Repubblica di San Marino
2022
Methodology
This ETC HE study quantifies and monetizes losses potato production due to tropospheric ozone pollution in 2022 in Europe. It uses the POD6spec methodology and the flux-effect function recommended by the Mapping Manual of the Air Convention. In terms of data sources, Eurostat data on wheat and potato production at level 2 of the Nomenclature of Territorial Units for Statistics (NUTS 2) were used. When not available, regional data were estimated from national production information, using the number of holdings by area category (ha) and by region as a proxy. Crop production data were then spatialised on a grid of 2 km × 2 km using Corine Land Cover land use classes, impacts were calculated at grid level and then aggregated at a country level. Wheat and potato production data from EUROSTAT are used together with international wheat and potato prices calculated by dividing the Gross production value of wheat and potatoes in 2022 by the production quantities, both from FAOSTAT and EUROSTAT.