All official European Union website addresses are in the europa.eu domain.
See all EU institutions and bodiesAn official website of the European Union | How do you know?
Environmental information systems
EN
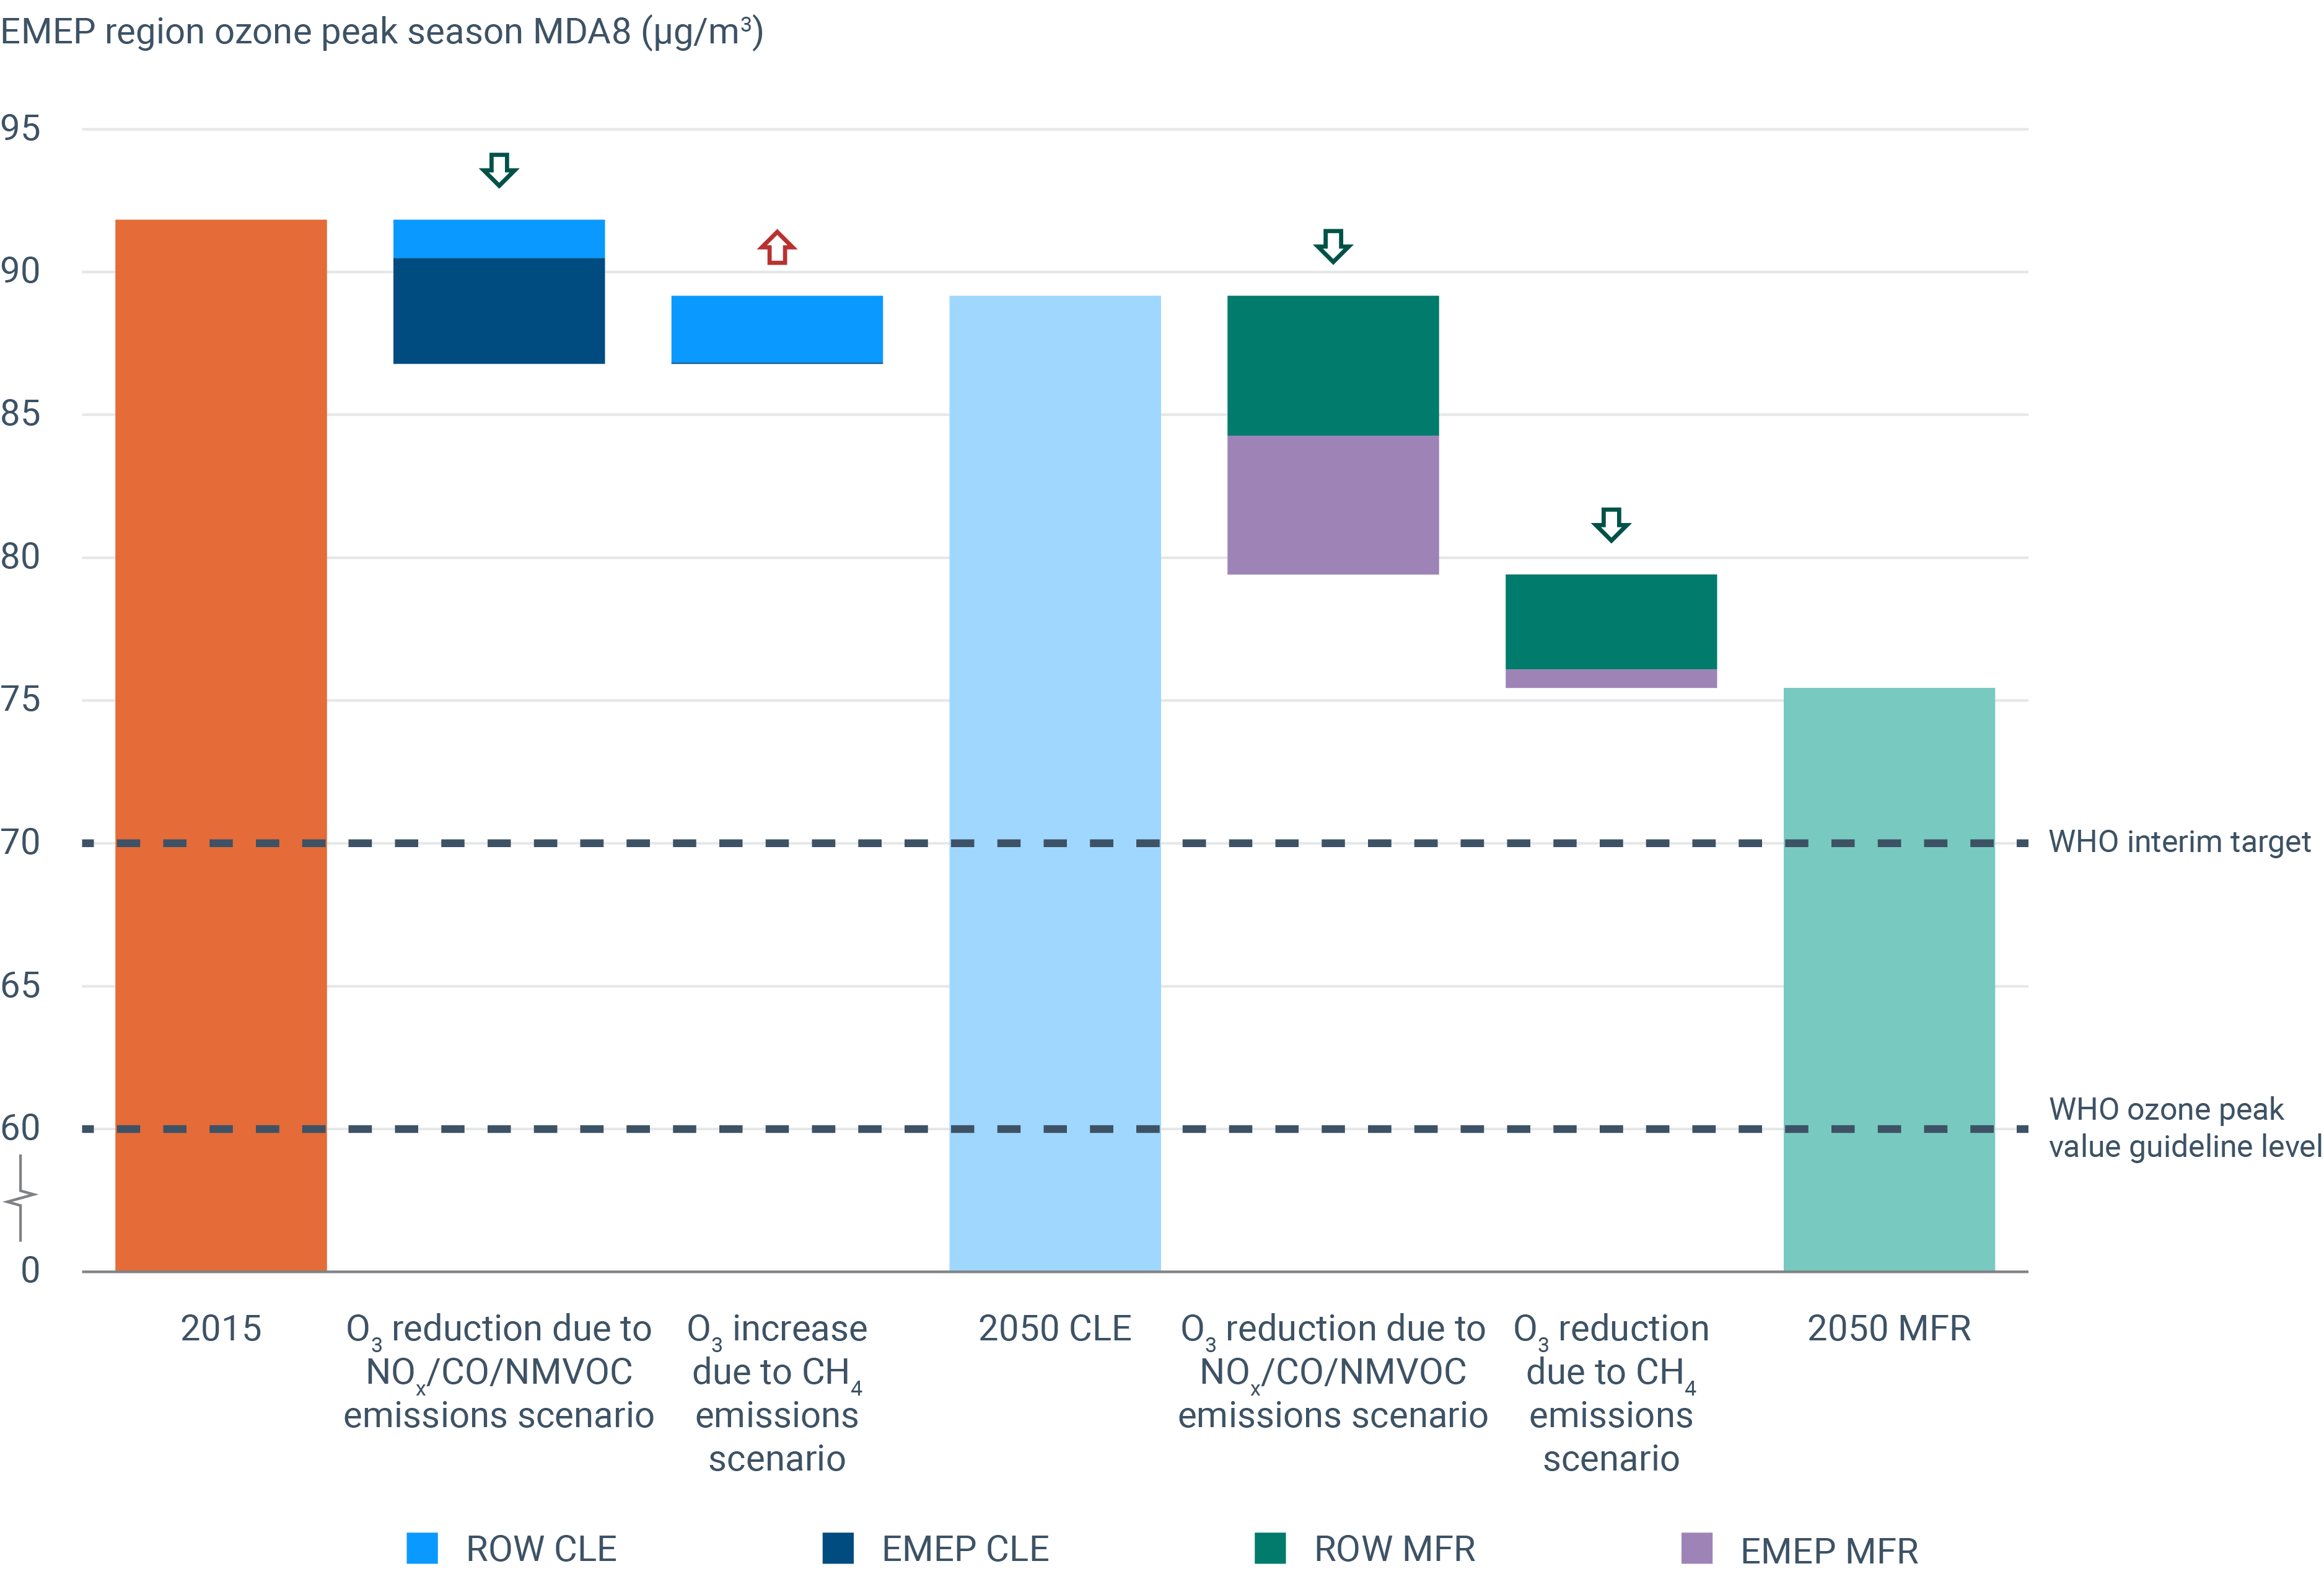
This chart shows the estimation of ozone exposure for 2015 and two 2050 scenarios assessed with the EMEP model in the framework of the revision of the Gothenburg Protocol. Population weighted average peak season MDA8 arising from NOx, CO, and NMVOC emission changes within the EMEP region (European countries of the UNECE region, dark blue for the CLE scenario and violet for the MFR scenario) and Rest of the World (ROW, light blue for the CLE scenario and dark green for the MFR scenario) regions, and from background CH4 changes arising from the EMEP (dark blue for the CLE scenario and violet for the MFR scenario) and ROW (light blue for the CLE scenario and dark green for the MFR scenario) region emission changes. The dashed horizontal lines denote guideline and interim ozone peak season WHO target values, respectively. Note that the y-axis starts at 50 µg m−3. Adapted from EMEP Status report 2023 and Caspel et al., 2024
Data-package.zip
Loading