All official European Union website addresses are in the europa.eu domain.
See all EU institutions and bodiesAn official website of the European Union | How do you know?
Environmental information systems
EN
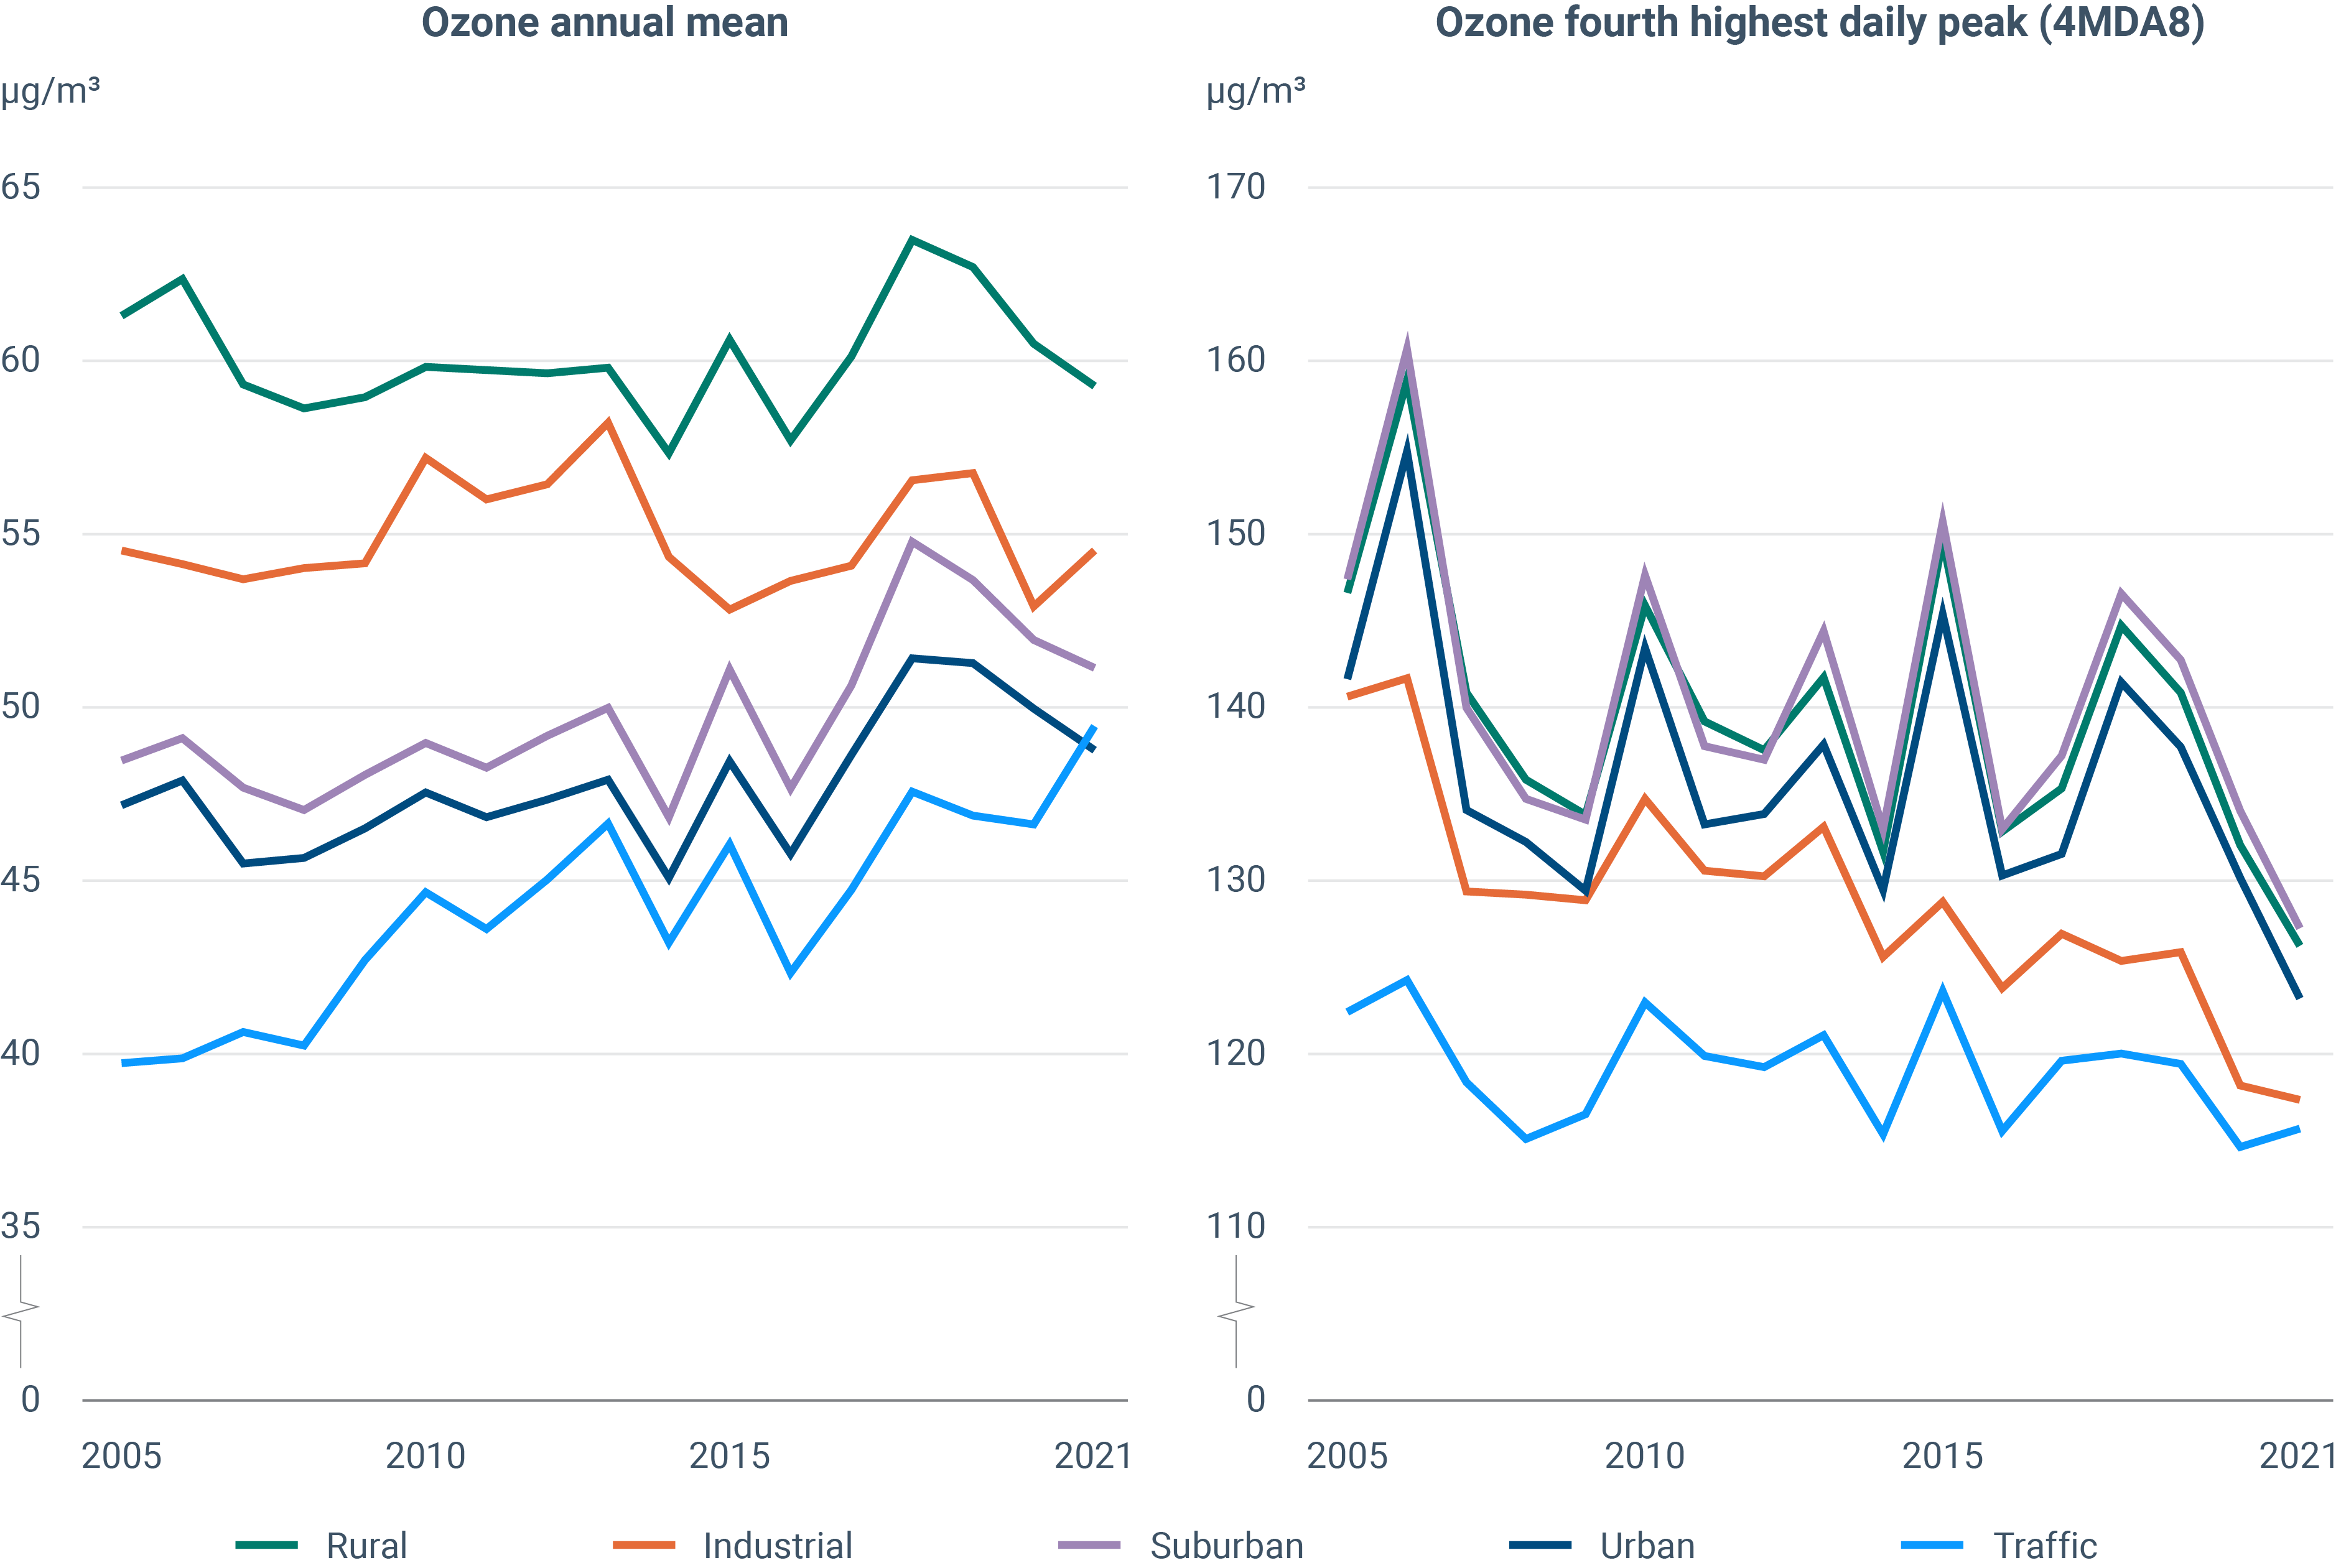
The chart shows the time series of the European-wide composite (median) per station typology between 2005 and 2021. Representing the ozone annual mean (left), and the fourth highest daily peak (4MDA8, right).
Data-package.zip
Loading