All official European Union website addresses are in the europa.eu domain.
See all EU institutions and bodiesAn official website of the European Union | How do you know?
Environmental information systems
EN
- БългарскиBG
- češtinaCS
- HrvatskiHR
- danskDA
- NederlandsNL
- ελληνικάEL
- EnglishEN
- eestiET
- SuomiFI
- FrançaisFR
- DeutschDE
- magyarHU
- ÍslenskaIS
- italianoIT
- LatviešuLV
- lietuviųLT
- MaltiMT
- NorskNO
- polskiPL
- PortuguêsPT
- RomânăRO
- slovenčinaSK
- SlovenščinaSL
- EspañolES
- SvenskaSV
- TürkçeTR
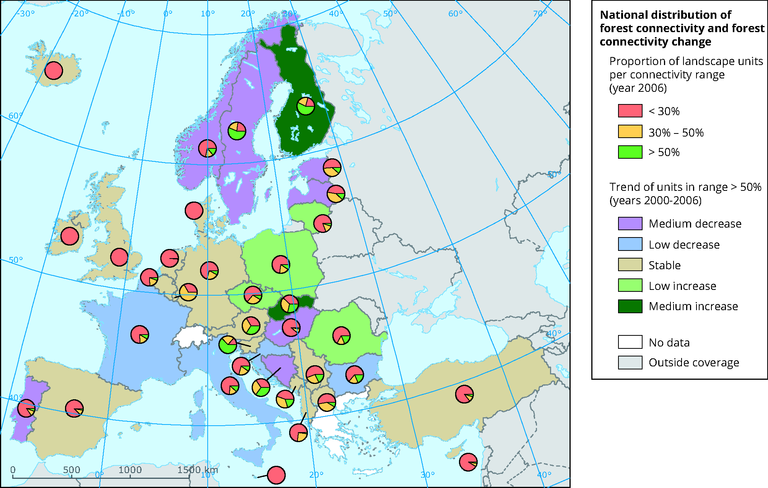
National distribution of forest connectivity for year 2006 and forest connectivity change in the period 2000-2006
Map (static)
The map show the proportion of landscape units per connectivity range reported by country for the year 2006.
The trend (medium/low increase/decrease or stable) in the proportion of units in a high connectivity range (above 50%) is given for the period 2000-2006 per country.
Species dispersing is 1 km.
Downloads
Data sources
Metadata
More info
Loading
- Landscape mosaic pattern maps raster data years 2000 and 2006
- Albania
- Austria
- Belgium
- Bosnia and Herzegovina
- Bulgaria
- Croatia
- Cyprus
- Czechia
- Denmark
- Estonia
- Finland
- France
- Germany
- Hungary
- Iceland
- Ireland
- Italy
- Kosovo (UNSCR 1244/99)
- Latvia
- Lithuania
- Luxembourg
- Malta
- Montenegro
- Netherlands
- Norway
- Poland
- Portugal
- Romania
- Serbia
- Slovakia
- Slovenia
- Spain
- Sweden
- Switzerland
- North Macedonia
- Turkey
- United Kingdom
2000-2006
Methodology
Methodology for the calculation: forest lands include Corine Land Cover (CLC) classes Broad-leaved forest (3.1.1), Coniferous forest (3.1.2) and Mixed forest (3.1.3), young plantations when 500 subjects/ha and transitional woodland when canopy closure is higher than 50 %. A forest connectivity index (Estreguil et al., 2012, 2013) is calculated per landscape units of 25 km x 25 km for forest dwelling species dispersing in average 1 km. Landscapes including woods have a varying connectivity index from above 0% (few woodlands and highly isolated) to 100% (all woods maximally connected). The pie charts show per country the proportion of landscape units in three connectivity ranges (below 30%; 30-50% ; above 50%). The change of the proportion of landscape units with forest highly connected (above 50%) is also reported per country for the period 2000-2006.
Units
Proportion of landscape units per 3 forest connectivity ranges and trends of units for connectivity range >50
Additional information
How to read the map:
The proportion of landscape units per connectivity ranges is reported by country for the year 2006. The trend (medium/low increase/decrease or stable) of the proportion of units in a high connectivity range (above 50%) is given for the period 2000-2006 per country. Estonia and Lithuania, two countries with the same amount of forests (2.2 million ha), exhibit a different landscape distribution per connectivity ranges (81% of landscapes with poorly connected woodlands in Lithuania versus 51% in Estonia). In the period 2000-2006, landscapes with well-connected forest lands (connectivity above 50%) tended to increase in Lithuania but to decrease in Estonia.
Source: European Commission-Joint Research Centre (JRC); Estreguil et al., 2012