All official European Union website addresses are in the europa.eu domain.
See all EU institutions and bodies
An official website of the European Union | How do you know?
Environmental information systems
EN

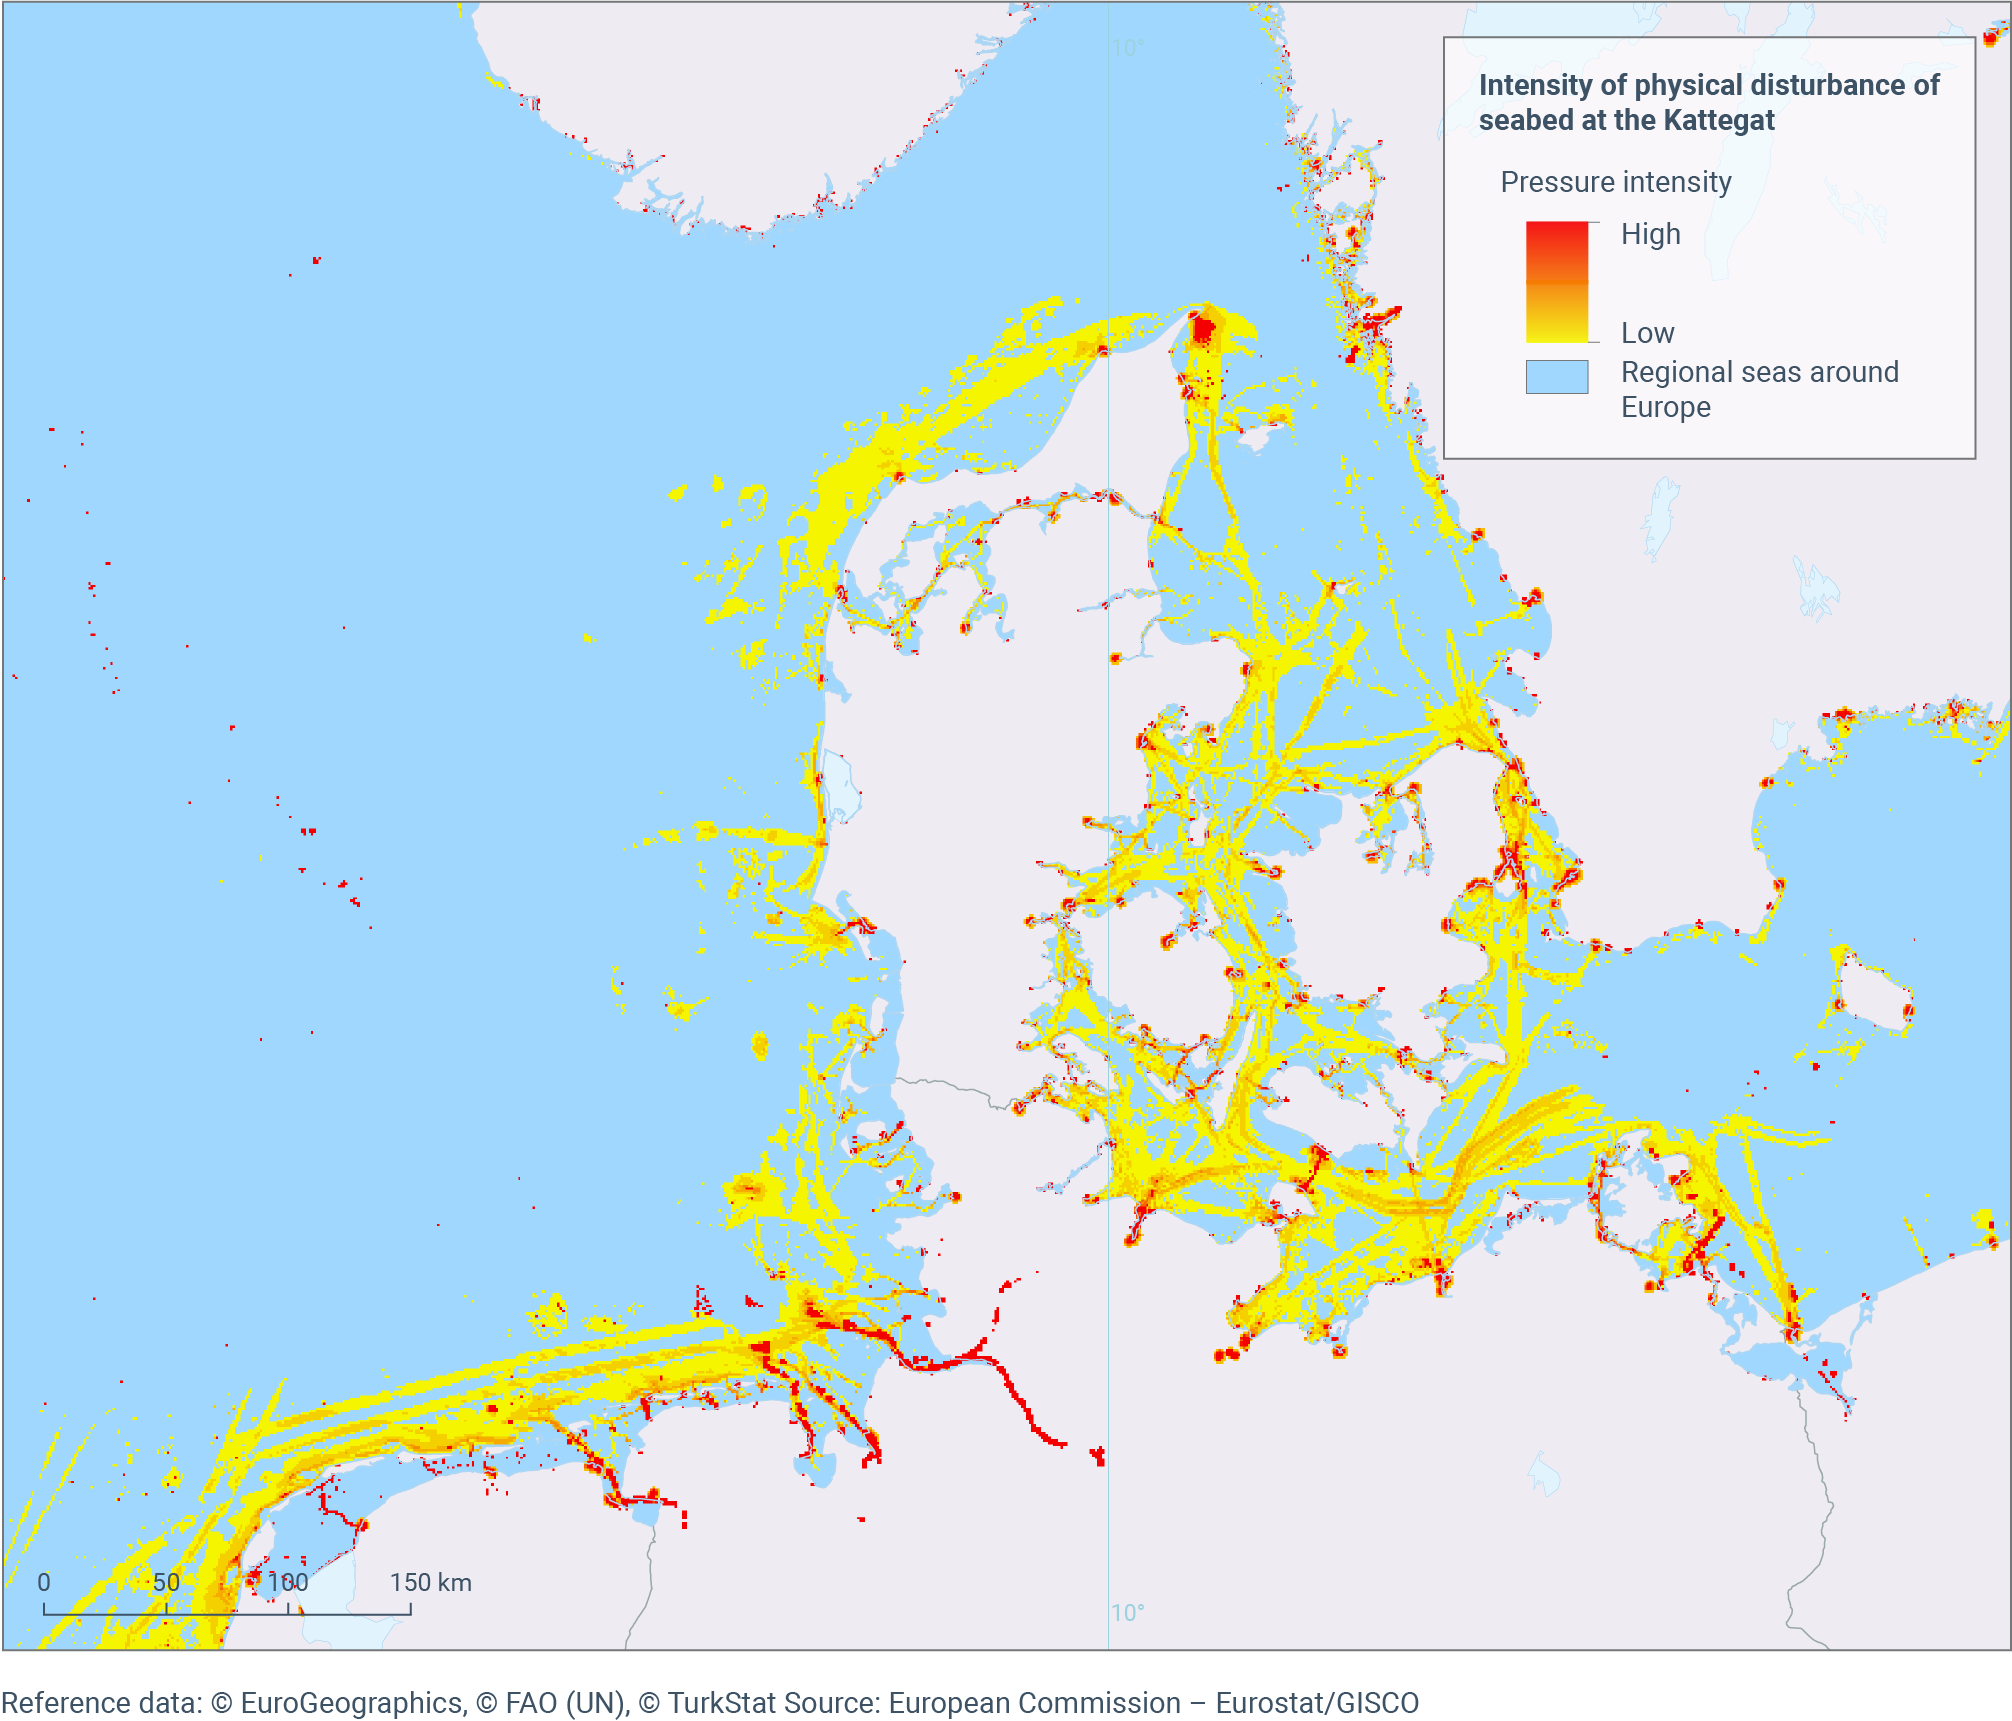
The map shows the combined effects of maritime traffic, including port activities (e.g. expansion of port facilities, harbour dredging), ship lane maintenance by dredging, ship anchoring as well as shipping caused turbidity. Analysed pressure and impacts datasets have been combined into a composite indicator where intensity of the pressure has been estimated on the scale from 0.1 (Low pressure) to 1 (High pressure). In the second step the corresponding layers were combined into composite physical disturbance of seabed grid pressure layer where final intensity value of each grid cell equals the maximum intensity value of all assessed layers in the corresponding cell.
Map-package.zip
Loading
