All official European Union website addresses are in the europa.eu domain.
See all EU institutions and bodiesAn official website of the European Union | How do you know?
Environmental information systems
EN
- БългарскиBG
- češtinaCS
- HrvatskiHR
- danskDA
- NederlandsNL
- ελληνικάEL
- EnglishEN
- eestiET
- SuomiFI
- FrançaisFR
- DeutschDE
- magyarHU
- ÍslenskaIS
- italianoIT
- LatviešuLV
- lietuviųLT
- MaltiMT
- NorskNO
- polskiPL
- PortuguêsPT
- RomânăRO
- slovenčinaSK
- SlovenščinaSL
- EspañolES
- SvenskaSV
- TürkçeTR
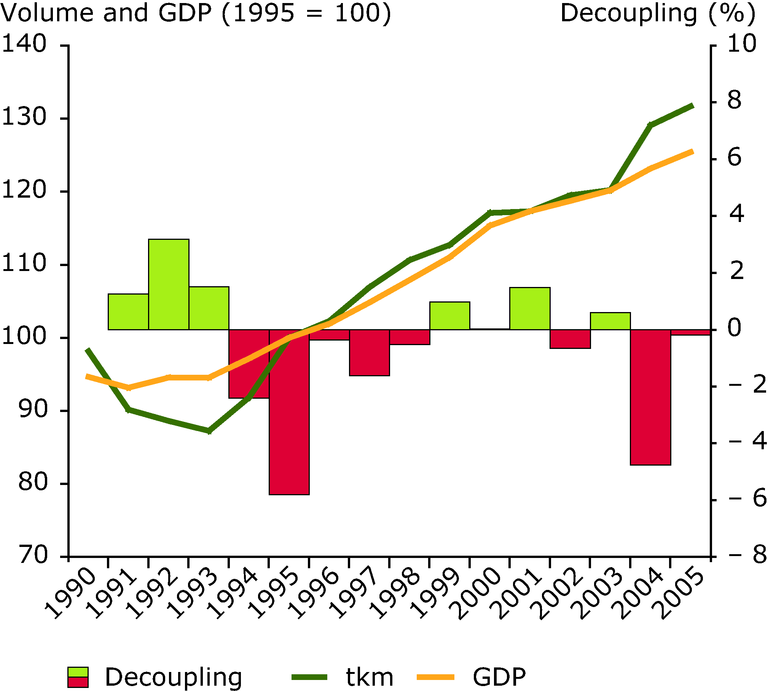
Freight transport volumes grow along with GDP
Chart (static)
Note: The decoupling columns displayed in the chart represent annual decoupling
Downloads
Data sources
Metadata
More info
Loading
A positive value (green column) indicates decoupling (percentage decline in transport intensity since the previous year). The transport demand growth between 2003 and 2004 may partly be caused by a change in methodology, but no correction figure exists. No data available for Switzerland or Liechtenstein. GDP is in euro at constant 1995 prices. Freight transport (tonne-kilometre) includes transport by road, rail and inland waterways. Short-sea shipping and oil pipelines are excluded due to lack of data.