All official European Union website addresses are in the europa.eu domain.
See all EU institutions and bodiesAn official website of the European Union | How do you know?
Environmental information systems
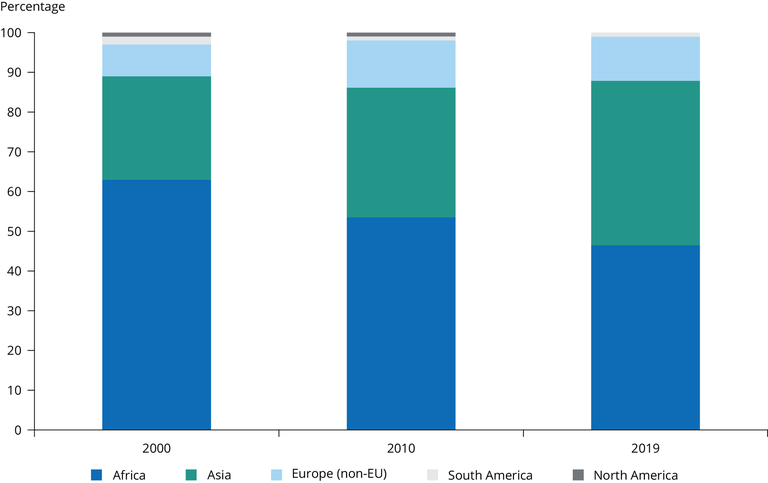
EU exports of used textiles to other regions, 2000, 2010 and 2019, percent
Chart (static)

Groupings of countries are based on those of the United Nations Statistical Office (UN Statistics Division, 2022).
Downloads
Data sources
Metadata
More info
Loading
- UN Comtrade; HS (as reported): 6309, 6310, Period: 2000, 2010, 2019 , Reporters: EU
- Austria
- Belgium
- Bulgaria
- Croatia
- Cyprus
- Czechia
- Denmark
- Estonia
- Finland
- France
- Germany
- Greece
- Hungary
- Ireland
- Italy
- Latvia
- Lithuania
- Luxembourg
- Malta
- Netherlands
- Poland
- Portugal
- Romania
- Slovakia
- Slovenia
- Spain
- Sweden
- United Kingdom
2000
2010
2019
